Creatore di Grafici per Sondaggi Online
Crea sondaggi professionali e ottieni le risposte di cui hai bisogno con Jotform. Personalizza i tuoi sondaggi per ottenere feedback approfonditi e crea facilmente grafici per rappresentare visivamente i risultati. Condividi le tue scoperte tramite un link o incorporando i report direttamente nel tuo sito web o portale online.
Modelli
Inizia con un Sondaggio Online
Non sai da dove cominciare? Scegli un modello già pronto da inviare ai tuoi abbonati in pochi secondi o da personalizzare con il nostro generatore senza scrivere codice.
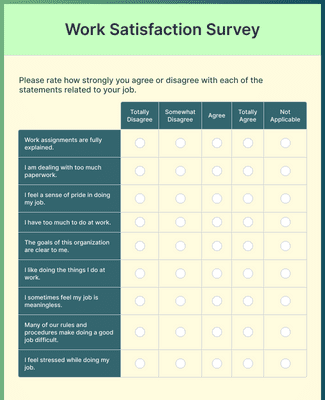
Sondaggio di Soddisfazione del Personale
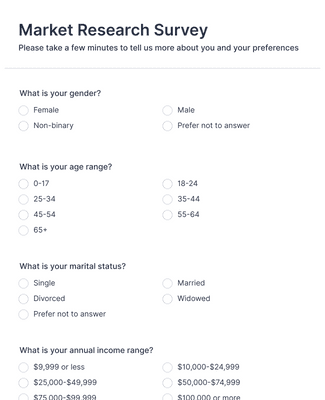
Sondaggio Ricerca di Mercato
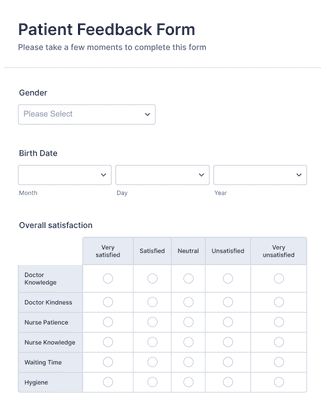
Modulo Feedback dei Pazienti
Benefici
Crea Sondaggi Istantaneamente
Gestione Centralizzata delle Risposte ai Sondaggi
Raccogli, organizza e analizza i dati dei sondaggi di cui hai bisogno su una piattaforma facile da usare. Crea moduli di sondaggio professionali da inviare al tuo pubblico e analizza i risultati senza problemi dal tuo account Jotform.
Genera Report Professionali per i Sondaggi
Trasforma le risposte del tuo sondaggio in report professionali con pochi clic. Scegli i tipi di grafici e tabelle dati che desideri. Carica immagini e seleziona palette di colori, forme e icone che meglio riflettono i tuoi risultati.
Condividi Facilmente i Risultati del Tuo Sondaggio
Condividi i tuoi sondaggi nel modo che meglio si adatta alle tue esigenze. Scarica facilmente i grafici e i report dei tuoi sondaggi come PDF per stamparli o inviarli, condividili tramite un link diretto o incorporali direttamente nel tuo portale online o sito web. Puoi anche aggiungere i link ai report dei sondaggi nei tuoi profili sui social media per raggiungere un pubblico più ampio.
Personalizza i Report
Il Generatore di Report di Jotform ti offre la possibilità di personalizzare i tuoi report per riflettere la voce unica del tuo marchio. Personalizza i tuoi report visivi con le nostre impostazioni di layout, impostazioni delle diapositive e suggerimenti utili e facili da configurare. Poi, condividi i tuoi report personalizzati con i membri del team e altri stakeholder.
Testimonianze
Cosa dicono i nostri utenti di Jotform
Scopri di più sul Creatore di Grafici per Sondaggi
Abbiamo una risposta a tutte le tue domande su Jotform. Consulta le nostre FAQ per le risposte alle domande più comuni o contatta il nostro team di supporto per ulteriori informazioni.
Come si crea un grafico per un sondaggio?
Creare un grafico per il sondaggio è semplice con Jotform. Per iniziare, segui questi semplici passaggi:
- Seleziona il modulo del sondaggio dal quale desideri generare un grafico nella pagina I Miei Moduli.
- Apri il menu Report.
- Clicca sul pulsante Aggiungi Nuovo Report.
- Seleziona l'opzione Generatore di Report Visivo per aprire il Generatore di Report.
- Inserisci un nome per il report.
- Seleziona il Tipo di Report che desideri, quindi clicca sul pulsante Crea.
- Per aggiungere grafici specifici, fai clic su + Aggiungi Elemento, poi su Campo del Modulo per scegliere i dati e il tipo di grafico.
Qual è il modo migliore per rappresentare graficamente i risultati dei sondaggi?
Ci sono molti modi per rappresentare graficamente i risultati dei sondaggi, da quelli più semplici a quelli più complessi, a seconda dei dati che stai presentando. Ad esempio, il grafico a barre impilate è una delle migliori opzioni per visualizzare i risultati delle domande con scala di valutazione in modo chiaro e facile da seguire.
Come visualizzi i risultati dei sondaggi?
Puoi visualizzare i risultati del tuo sondaggio utilizzando grafici, tabelle, icone, griglie e altro ancora, a seconda delle tue esigenze. Considera i seguenti tipi di grafici per rappresentare i risultati del tuo sondaggio:
- Grafico della Scala di Likert
- Diagramma a Barre dei Punteggi
- Diagramma a Barre delle Valutazioni
- Grafico Riassuntivo dei Punteggi del Sondaggio
- Grafico dei Dettagli dei Punteggi
- Tabella di Valutazione
- Grafico di Analisi del Sentimento
Come posso tenere traccia dei risultati del sondaggio con Jotform?
Con Jotform, è facile tenere traccia dei risultati del tuo sondaggio. Puoi visualizzare e organizzare tutti i dati inviati per il tuo modulo su Tabelle Jotform. Per avere una panoramica immediata, genera un report visivo con i dati del sondaggio utilizzando il Generatore di Report di Jotform.
Qual è il modo migliore per riassumere i dati dei sondaggi?
Riassumere i dati del tuo sondaggio è facile con Jotform. Genera automaticamente un report visivo per mostrare tutti i tuoi dati in grafici e tabelle facili da comprendere. Una volta creato il report, ricco di intuizioni e feedback degli utenti, personalizza il design secondo le tue esigenze e condividilo con altri.