Jotform Tables was created to let you, as the form owner, manage your data in a workspace that’s easy to navigate. It is also focused on collaboration, so your team can easily take part and manage your data.
While the main tab’s default Table view can be changed to a different view type, you can also add new tabs to your table and set them to the following views:
- Calendar
- Kanban
- Cards
- Uploads
- Reports
Different views offer unique features to help you manage, interpret, or analyze data you’ve collected from form submissions more effectively and efficiently. For each view type, you can choose specific form fields to include, making it easier to focus on the information you need most in that view.
Adding tabs to display submission data in different views is easy. Here’s how to get started:
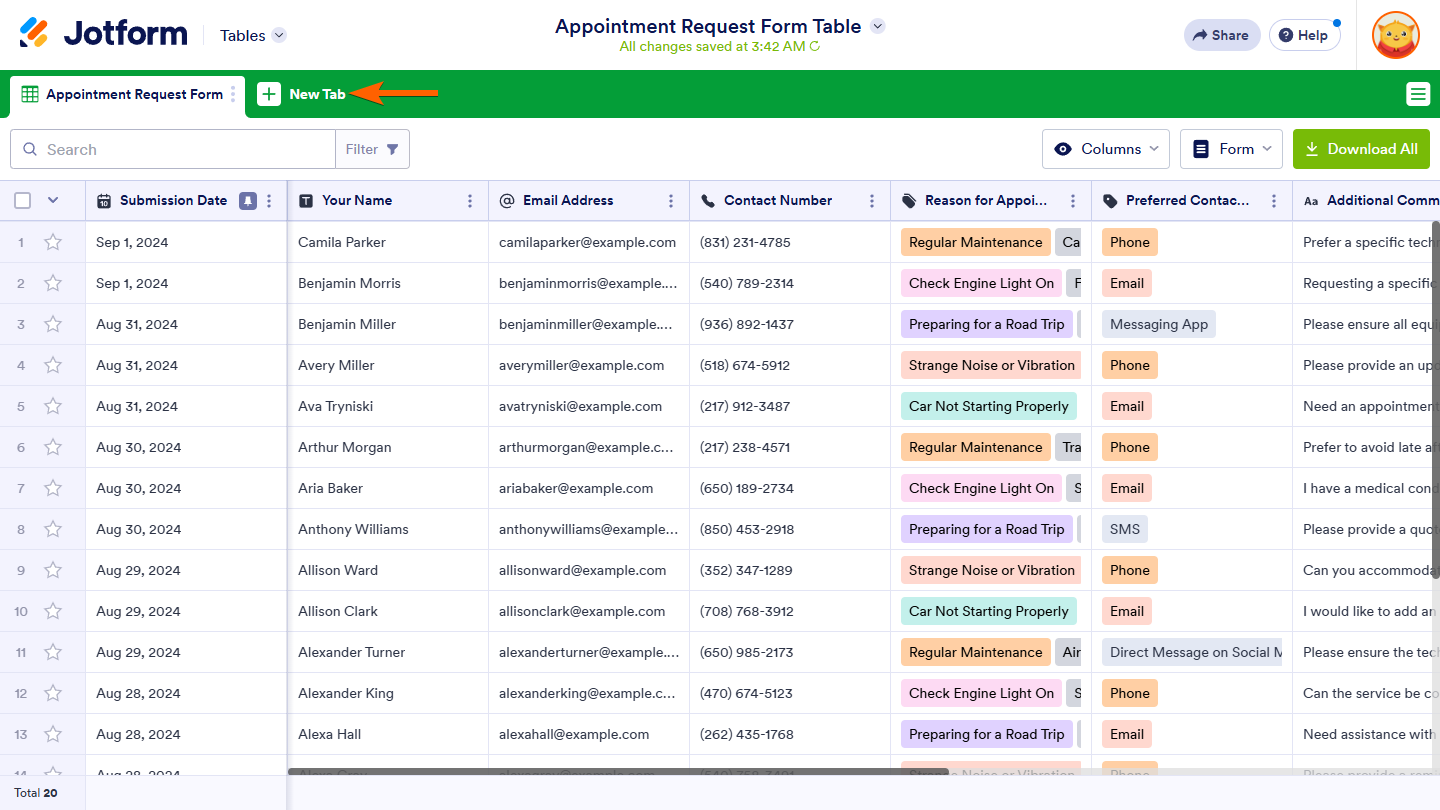
- In Jotform Tables, click on the New Tab button.
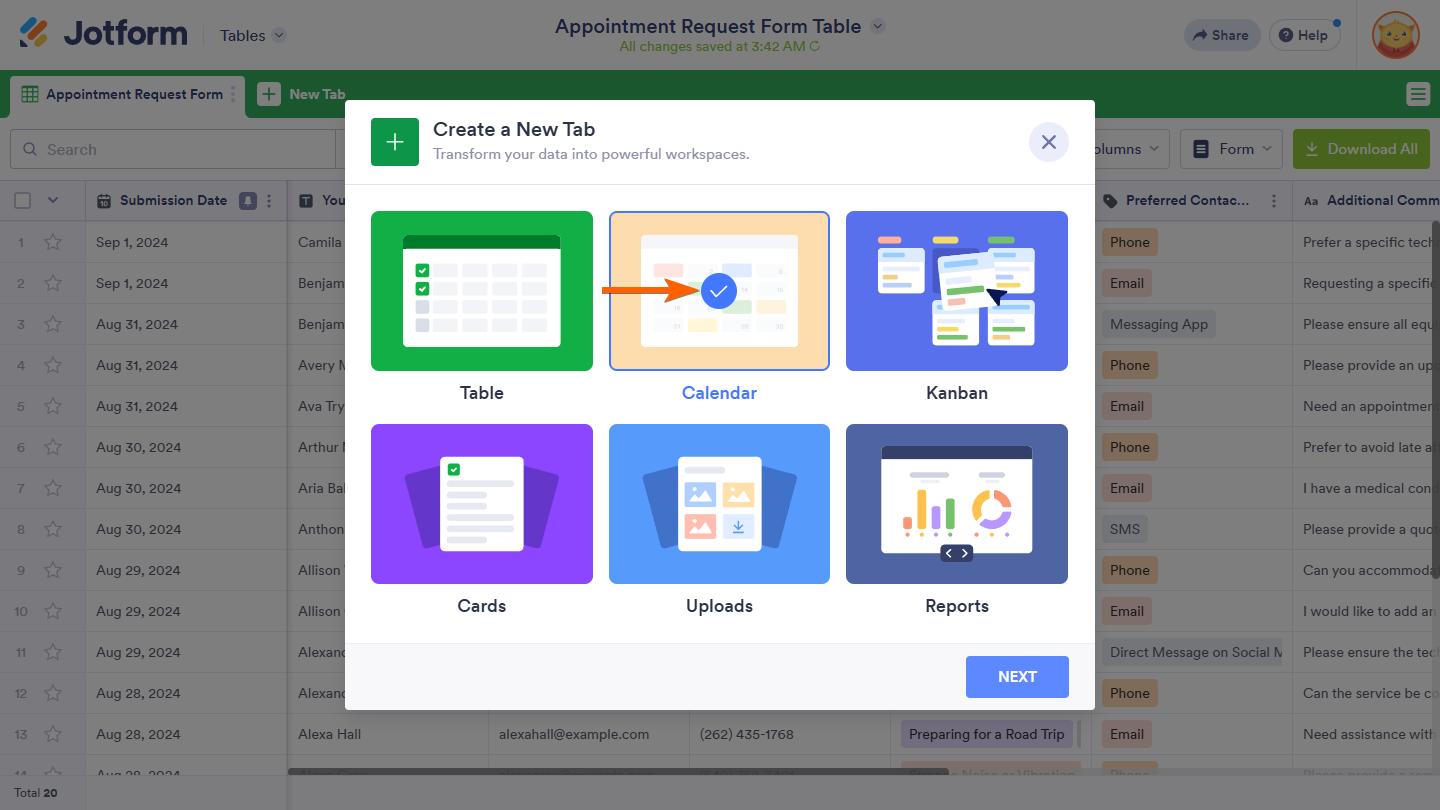
- In the Create a New Tab window, select a view, then click on Next.
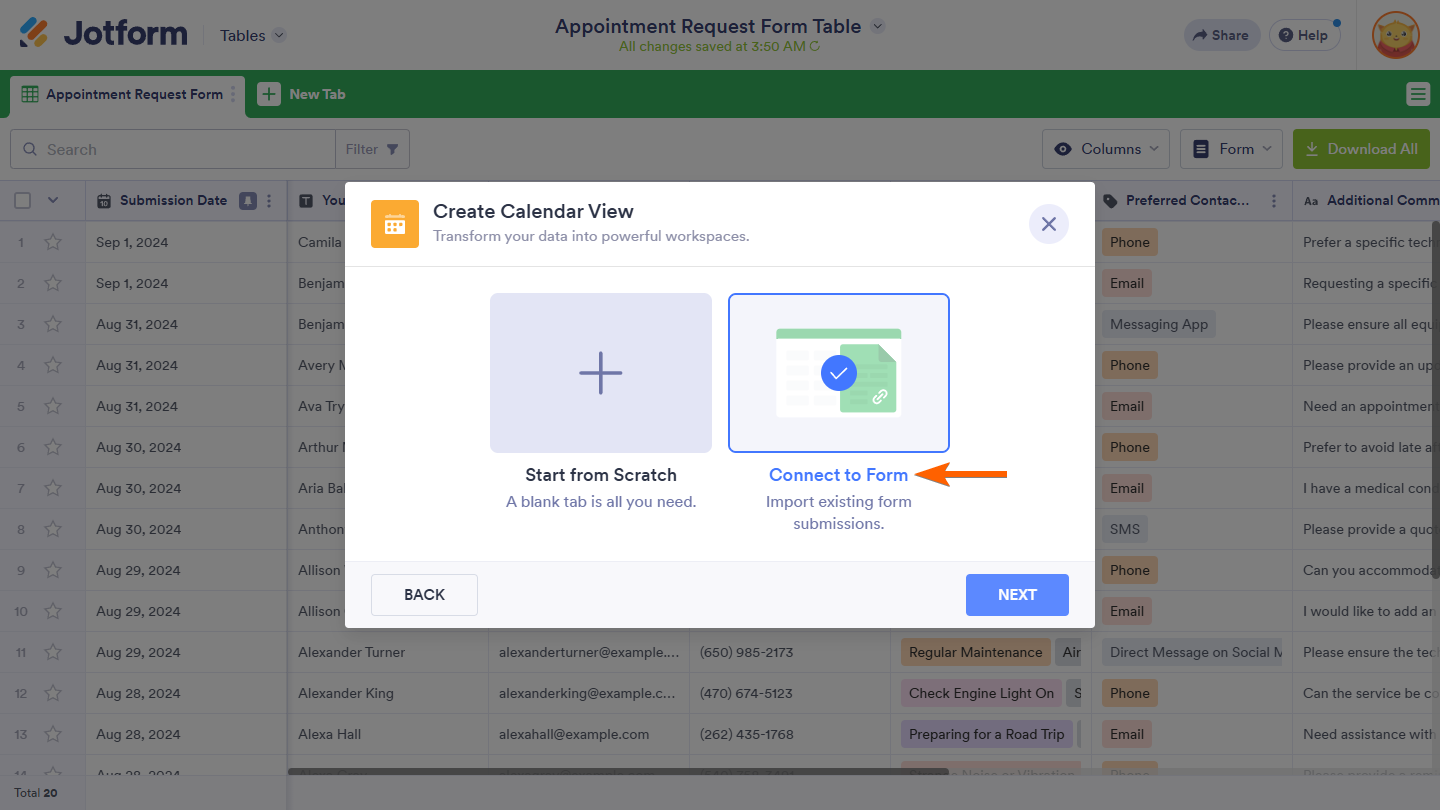
- In the next screen, choose Connect to Form, and click on Next.
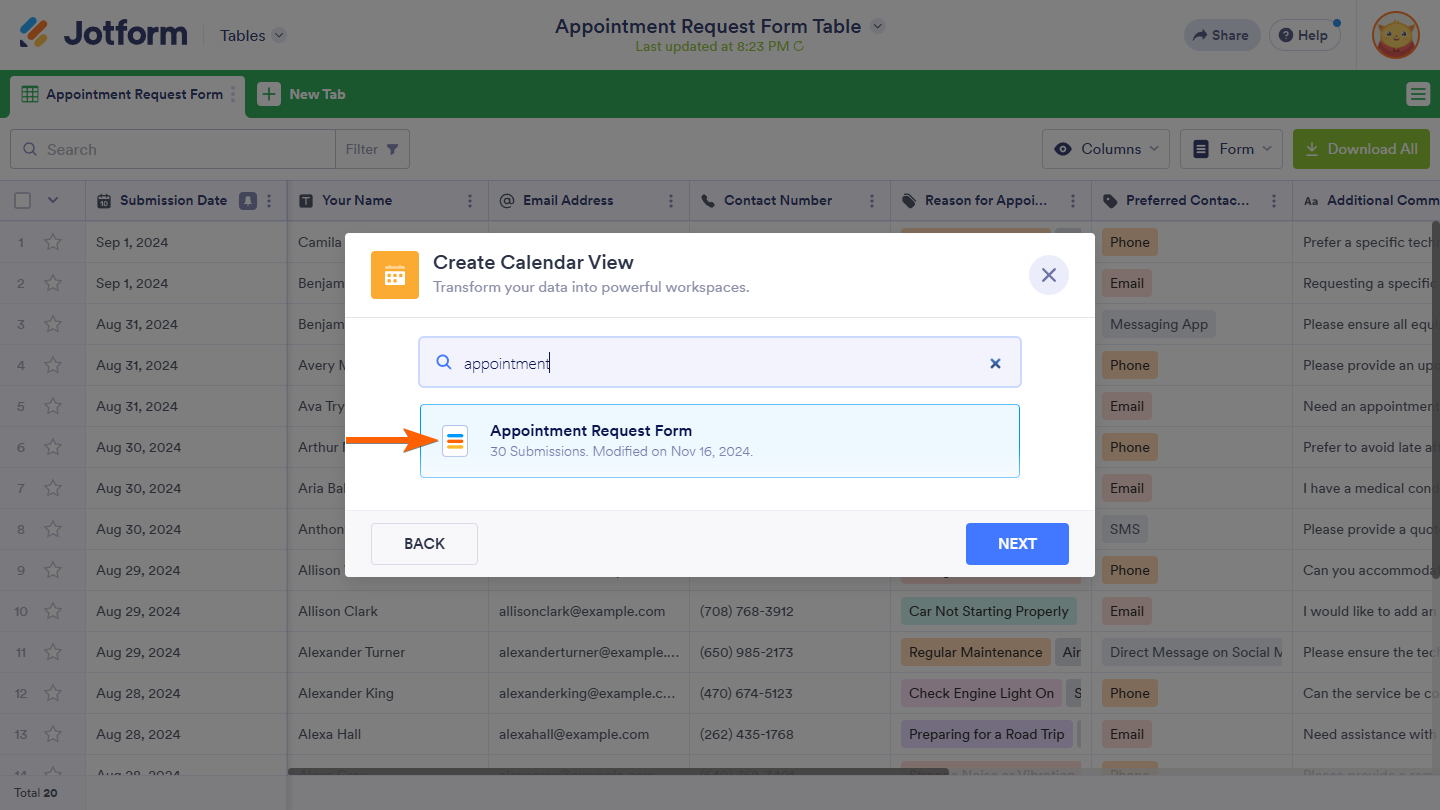
- After that, select a form and click on Next again. You can use the search bar to find a specific form easily.
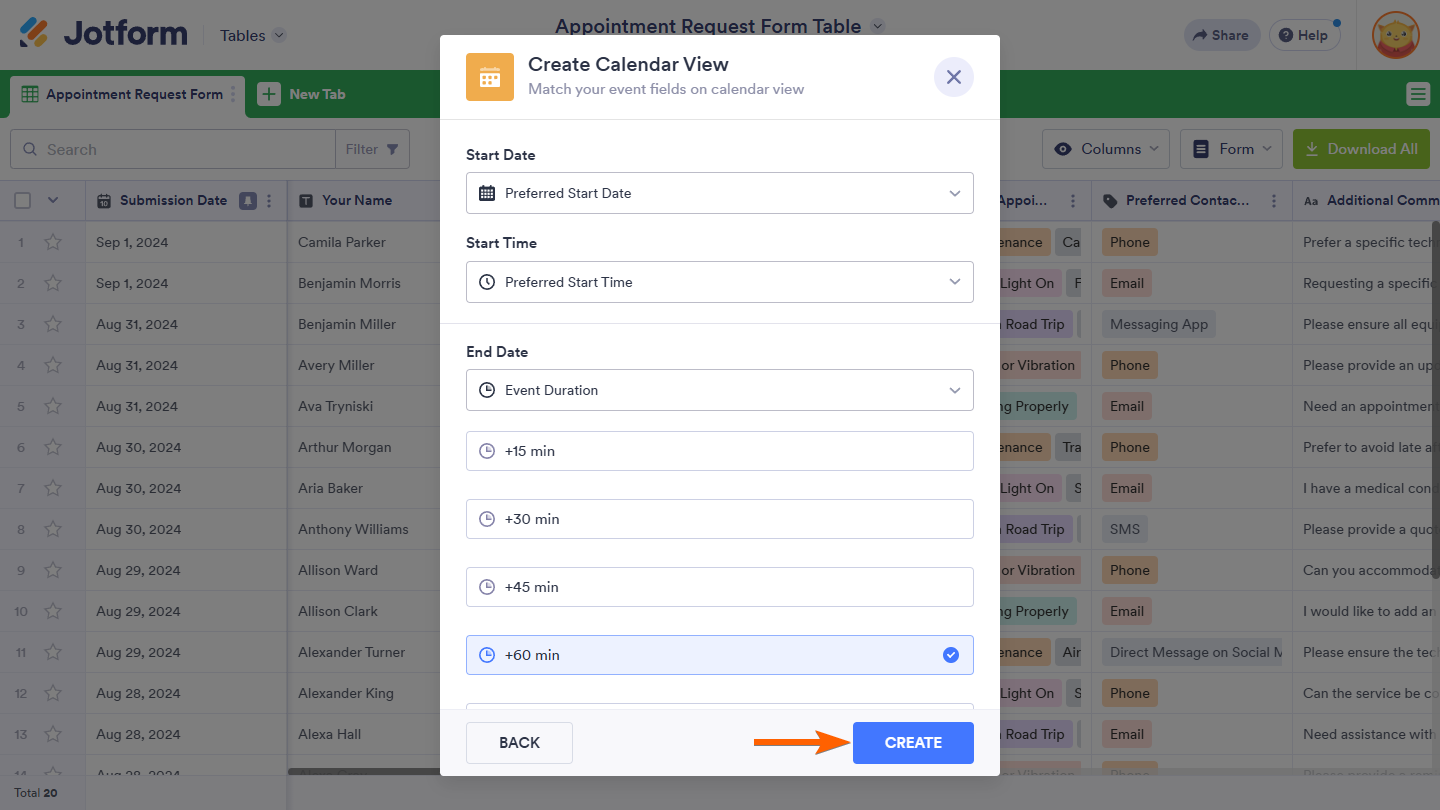
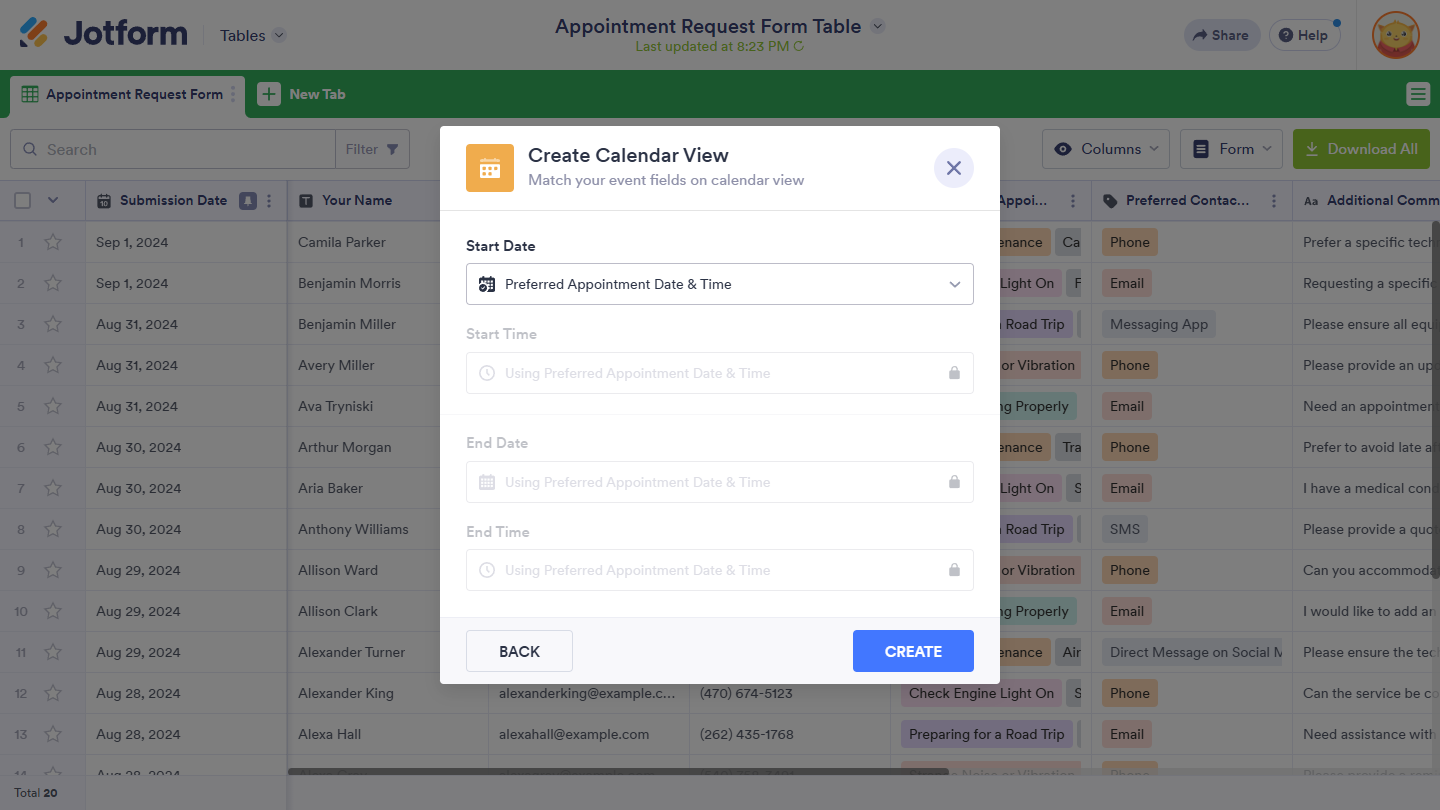
- Set up your view by including or matching form fields to what your selected view requires, then click on Create.
Calendar View
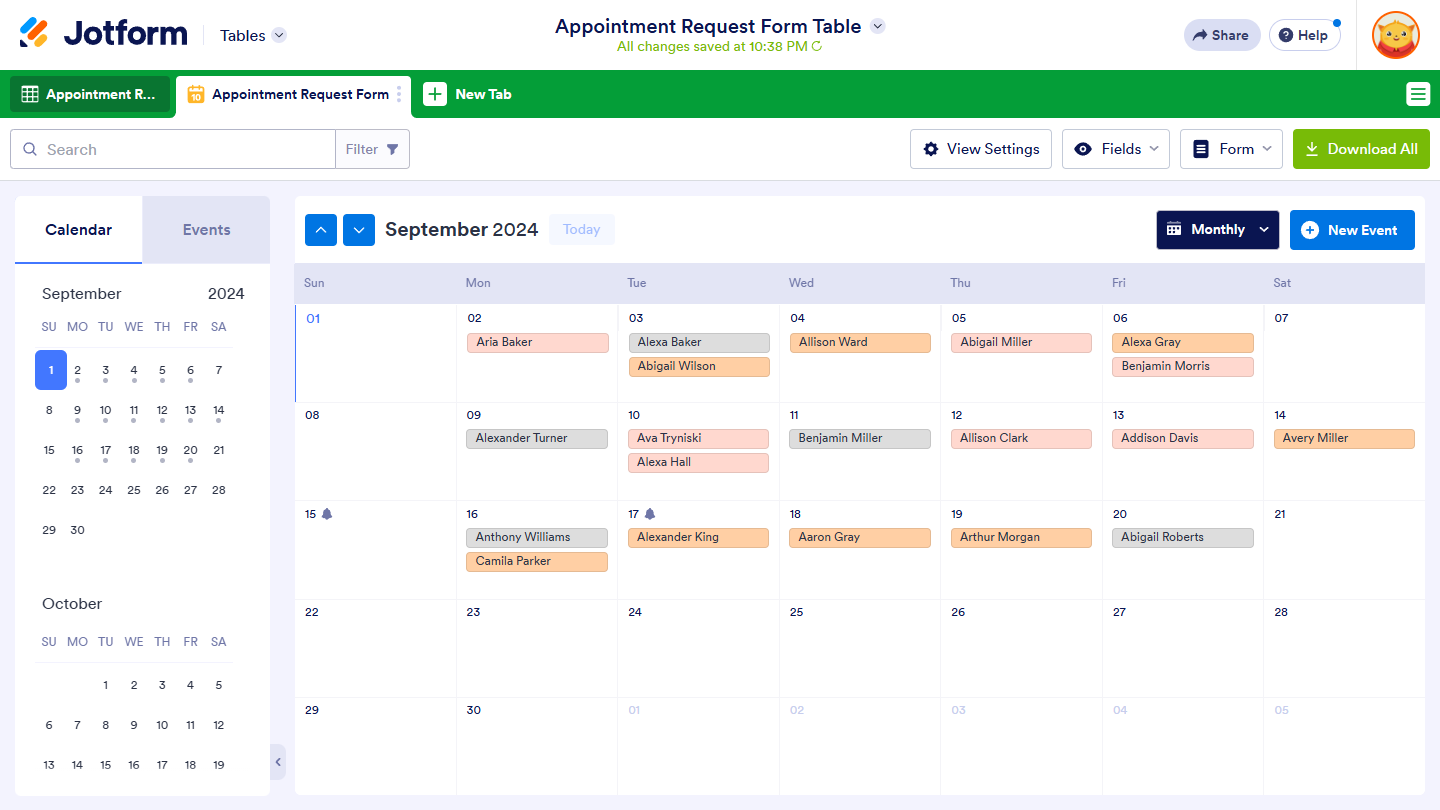
You can set up this view to turn submissions from your connected form into events displayed on a calendar. To do this, match the date or appointment fields in your form to the event date and time fields. This is ideal for forms that handle bookings, schedule appointments, collect RSVPs, and more.
This is an example of how the Calendar view displays your submissions.
Learn more about Calendar view here: How to Add a Calendar View in Jotform Tables.
Kanban View
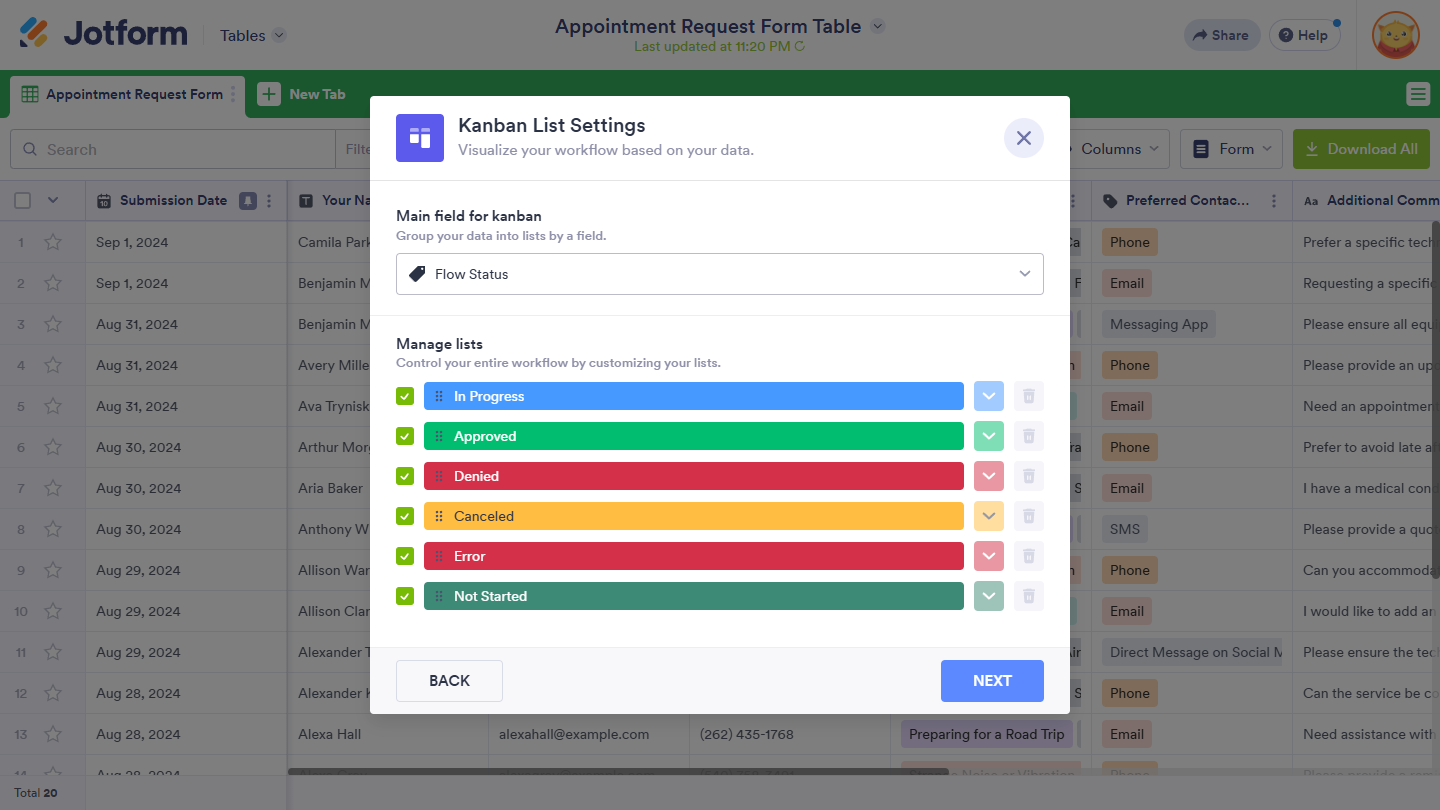
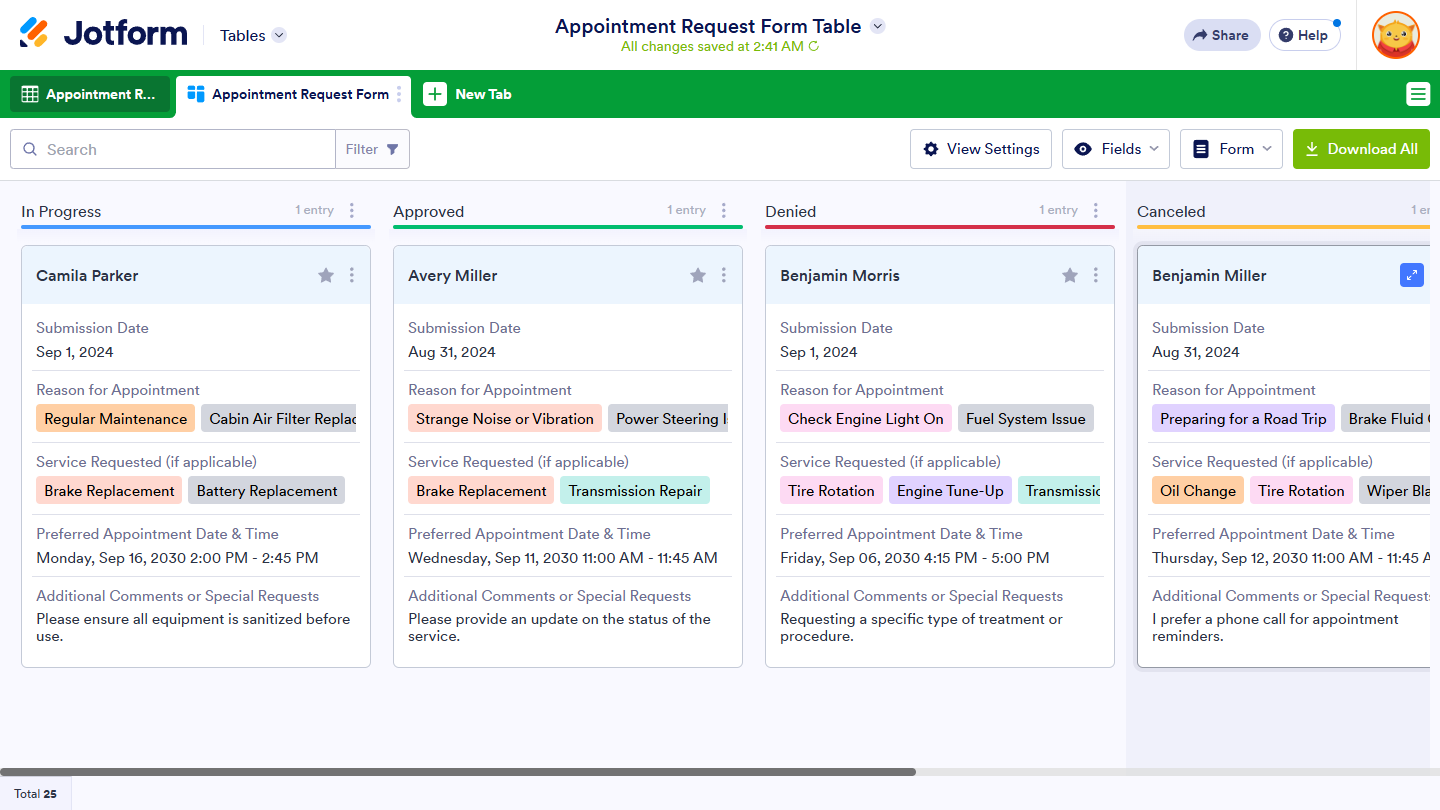
Set up this view to organize submissions from your connected form into a Kanban board on a new tab, grouping them into lists based on a single-choice field or the flow status. Use this setup to track progress, handle tasks, or categorize entries. Customize the view by selecting which lists to display, managing the fields shown in the cards under each list, and choosing a specific field to set as the card titles.
Here’s a preview of how the Kanban view organizes your submissions.
Cards View
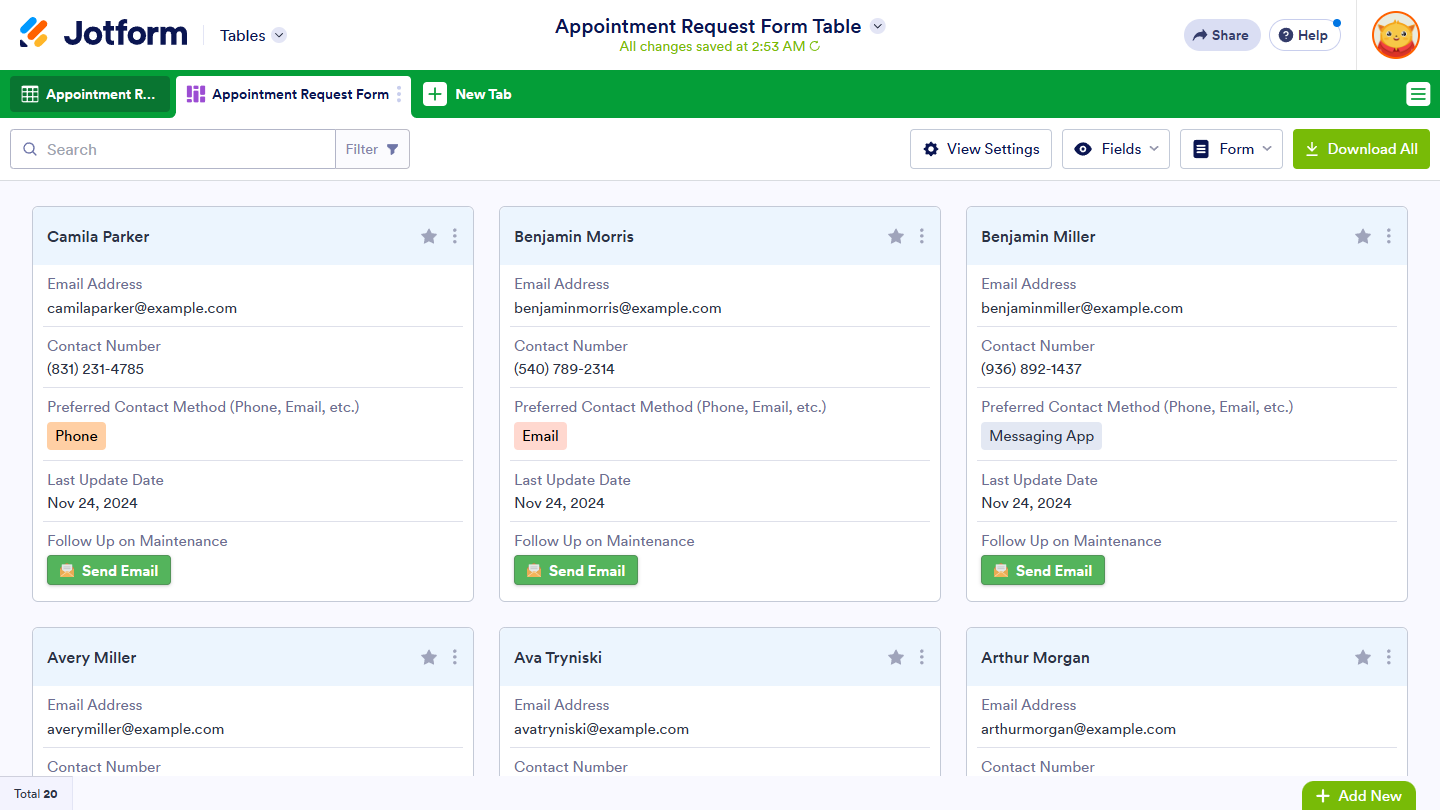
This view displays submissions from your connected form as customizable cards on a new tab, ideal for visually summarizing data like individual tasks or contact details. Choose which form fields appear on the cards and select a specific field as the card title, creating a clear and organized layout tailored to your needs.
This is an example of how Cards view displays your data.
Explore more information about Cards view here: How to Add a Cards View in Jotform Tables.
Uploads View
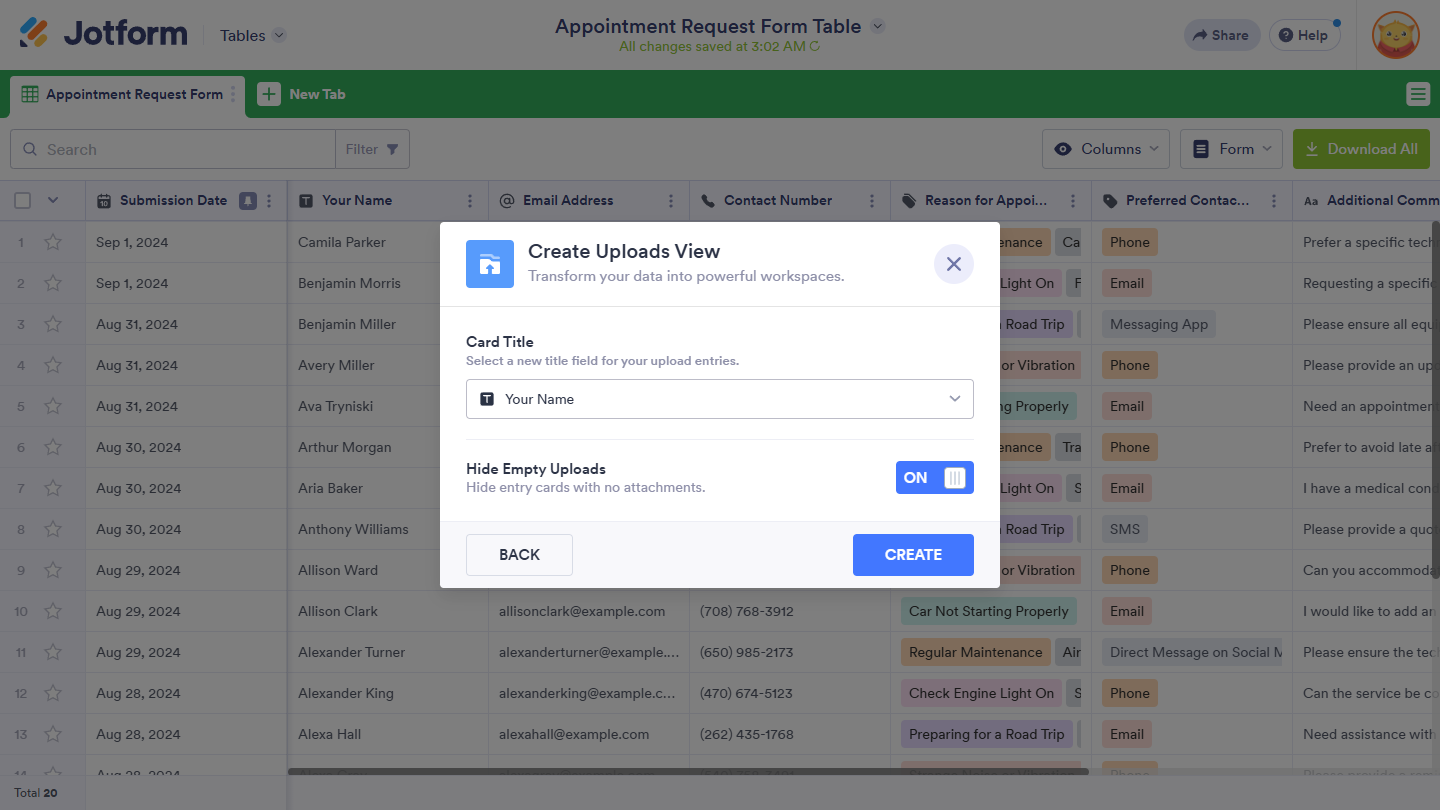
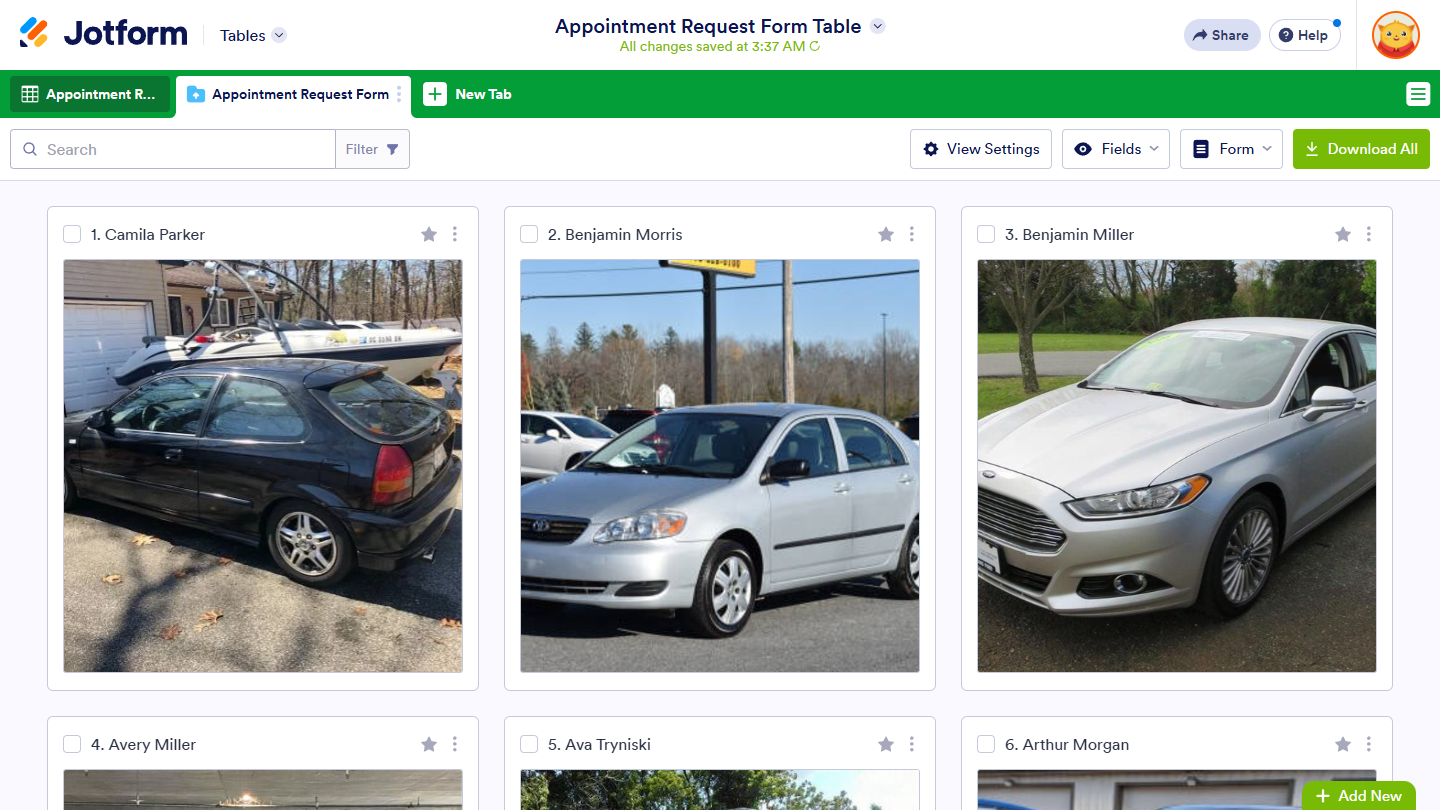
Set up this view to organize files uploaded in submissions from your connected form into a folder-style layout on a new tab. This is perfect for managing files like images or documents, and you can set folder titles to help categorize the entries for easy access.
Take a look at how the Uploads view arranges your files.
Find additional details about Uploads view here: How to Add an Uploads View in Jotform Tables.
Reports View
This view generates a visual report of your connected form’s submission data on a new tab, where you can choose the type of report to start with after selecting the form:
- Blank – This allows you to create a report from scratch.
- Extended – A single chart is shown on each page by default.
- Compact – Two charts are shown per page by default.
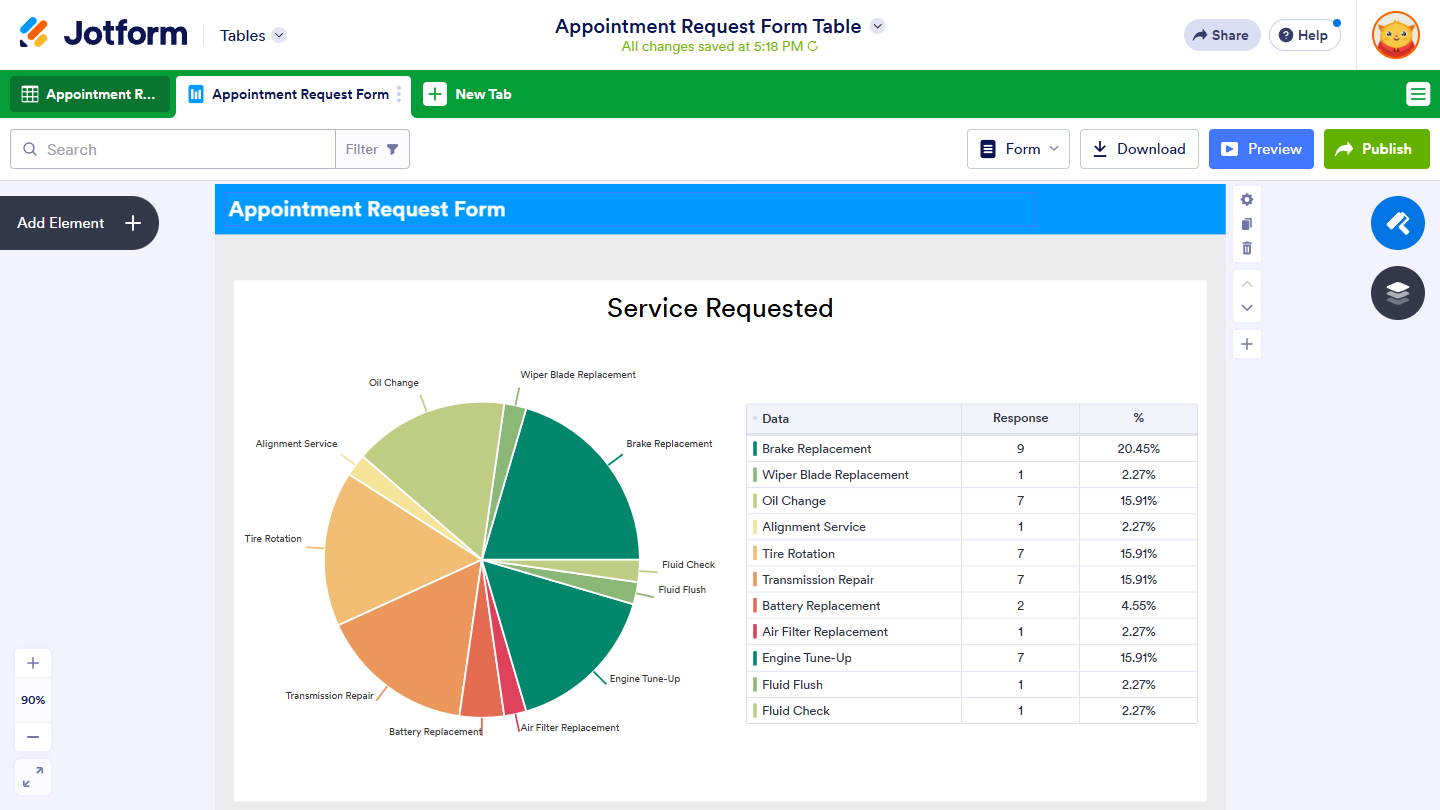
This is ideal for designing custom visual reports, such as charts, graphs, or grids to analyze trends and summarize submissions. You can also customize the layout to highlight key data in a way that makes the information easy to understand.
Here’s what the Reports view can present with your form data.
Get more information about Reports view here: How to Create Automated Reports in Jotform Tables.




Send Comment:
2 Comments:
More than a year ago
Hi,
How many tabs can one submission table have?
More than a year ago
I was testing the new tables stuff and created a new calendar tab. After some experimentation, I decided not to use the calendar, but when I go to delete the tab, I get a warning that it will delete all of my data permanently. Is this accurate? How do I delete the tab that I am not going to use?