words ~ min read
Visualizing your data with Jotform Report Builder
Jotform is great at saving time with automation. But even for us, the efficiency of Jotform Report Builder is something to behold.
For instance, the Santa Barbara Zoo used Report Builder to produce a visual aid for a presentation to its board of directors. Just as impressive, the zoo created the report in seconds despite never using Report Builder before.
“It literally took me under a minute to create the report,” says Wendy Campbell, creative brand manager at the Santa Barbara Zoo. “It was super, super easy, and I hadn’t used it before in terms of making a graph or a visual representation. It was a nice surprise, how easy it was to do.”
For a nonprofit organization that needs to operate efficiently, the benefits of the Report Builder are clear. Creating such reports used to require a graphic designer or pricey graphic design software. Now, Jotform can build a report in seconds.
We want all of our users to take advantage. Here are the essential features and benefits of Jotform Report Builder that all of our uses need to know about.
Data snapshot: Which forms are turned into reports the most?
It’s easy to turn submission data from any online form into a report using Jotform Report Builder. But what types of forms are transformed into reports the most? According to Jotform’s data team, survey forms are No. 1, followed by registration forms, and, unsurprisingly, report forms.

Easy report creation
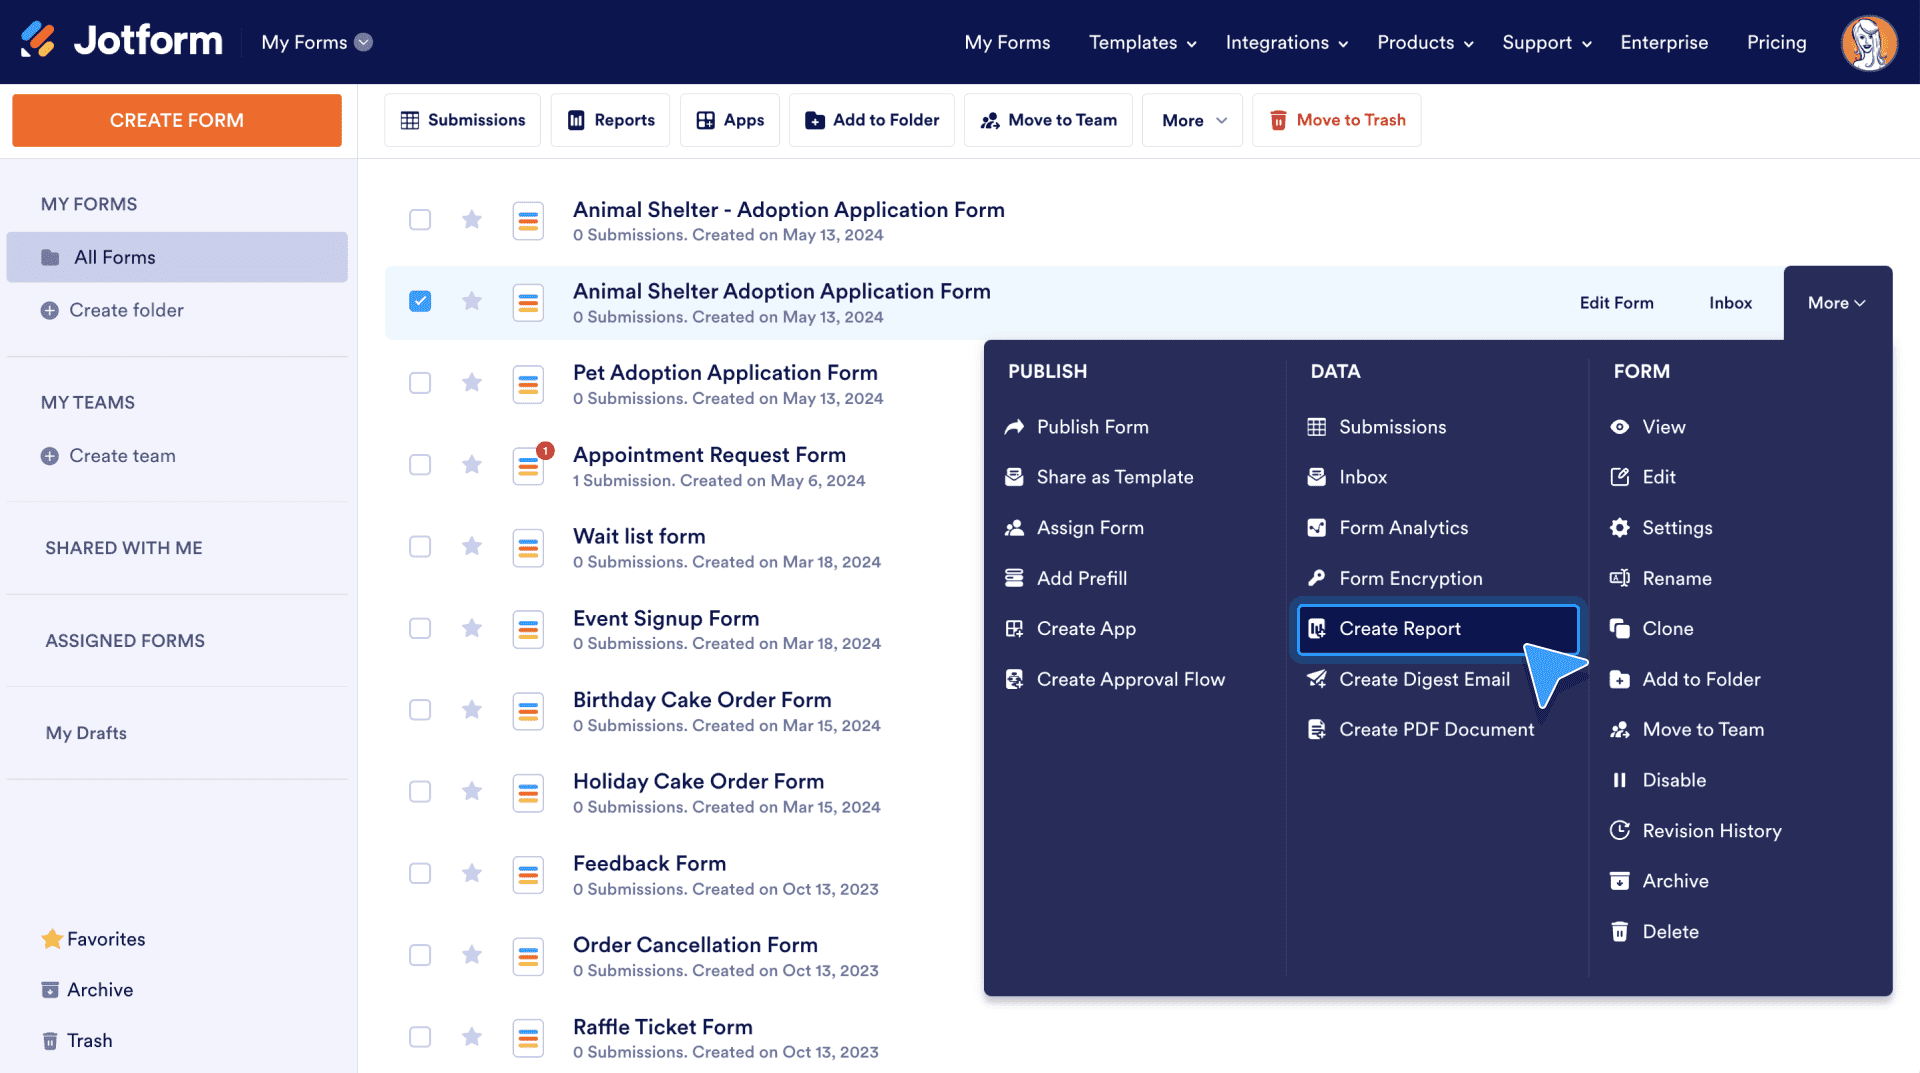
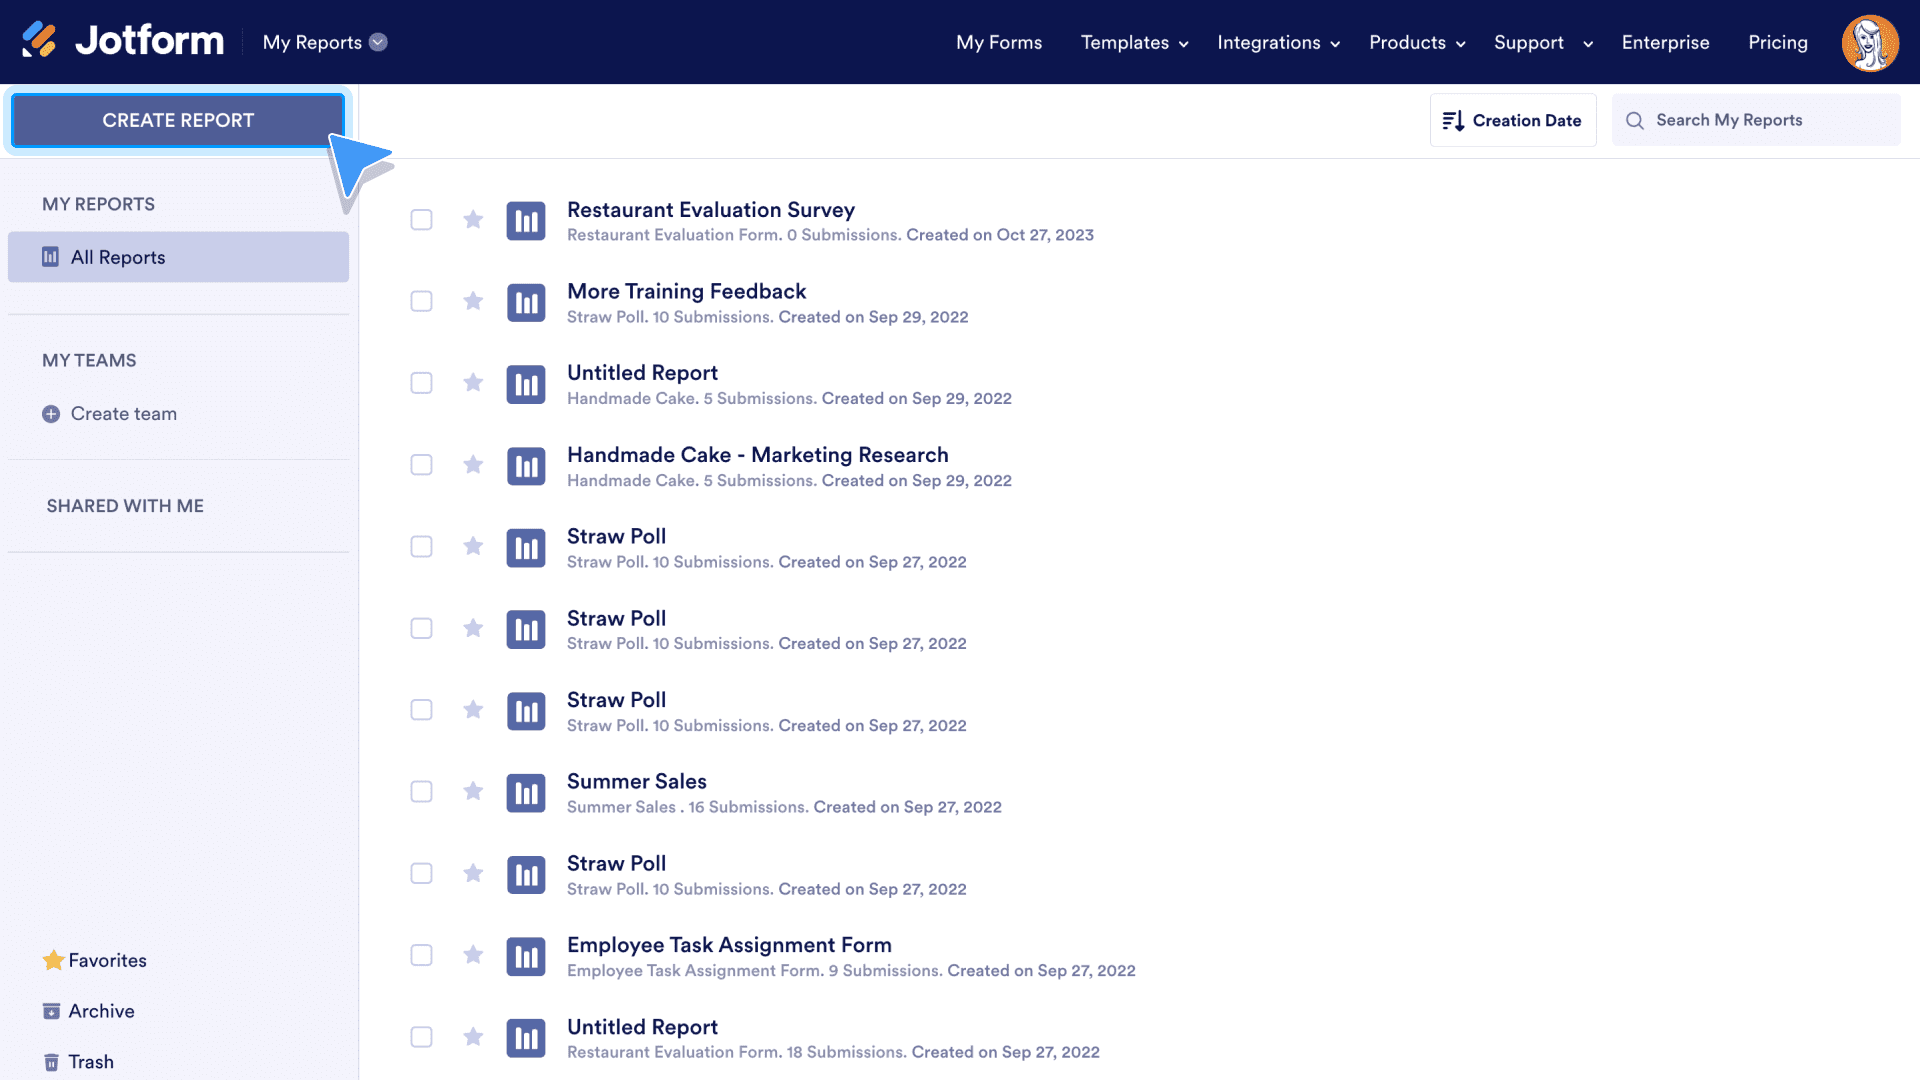
We’ve already mentioned how easy it is to create a report containing submission data. Now it’s time to take a closer look. There are multiple ways to begin report creation, so let’s start on a page every user is familiar with, the My Forms page.
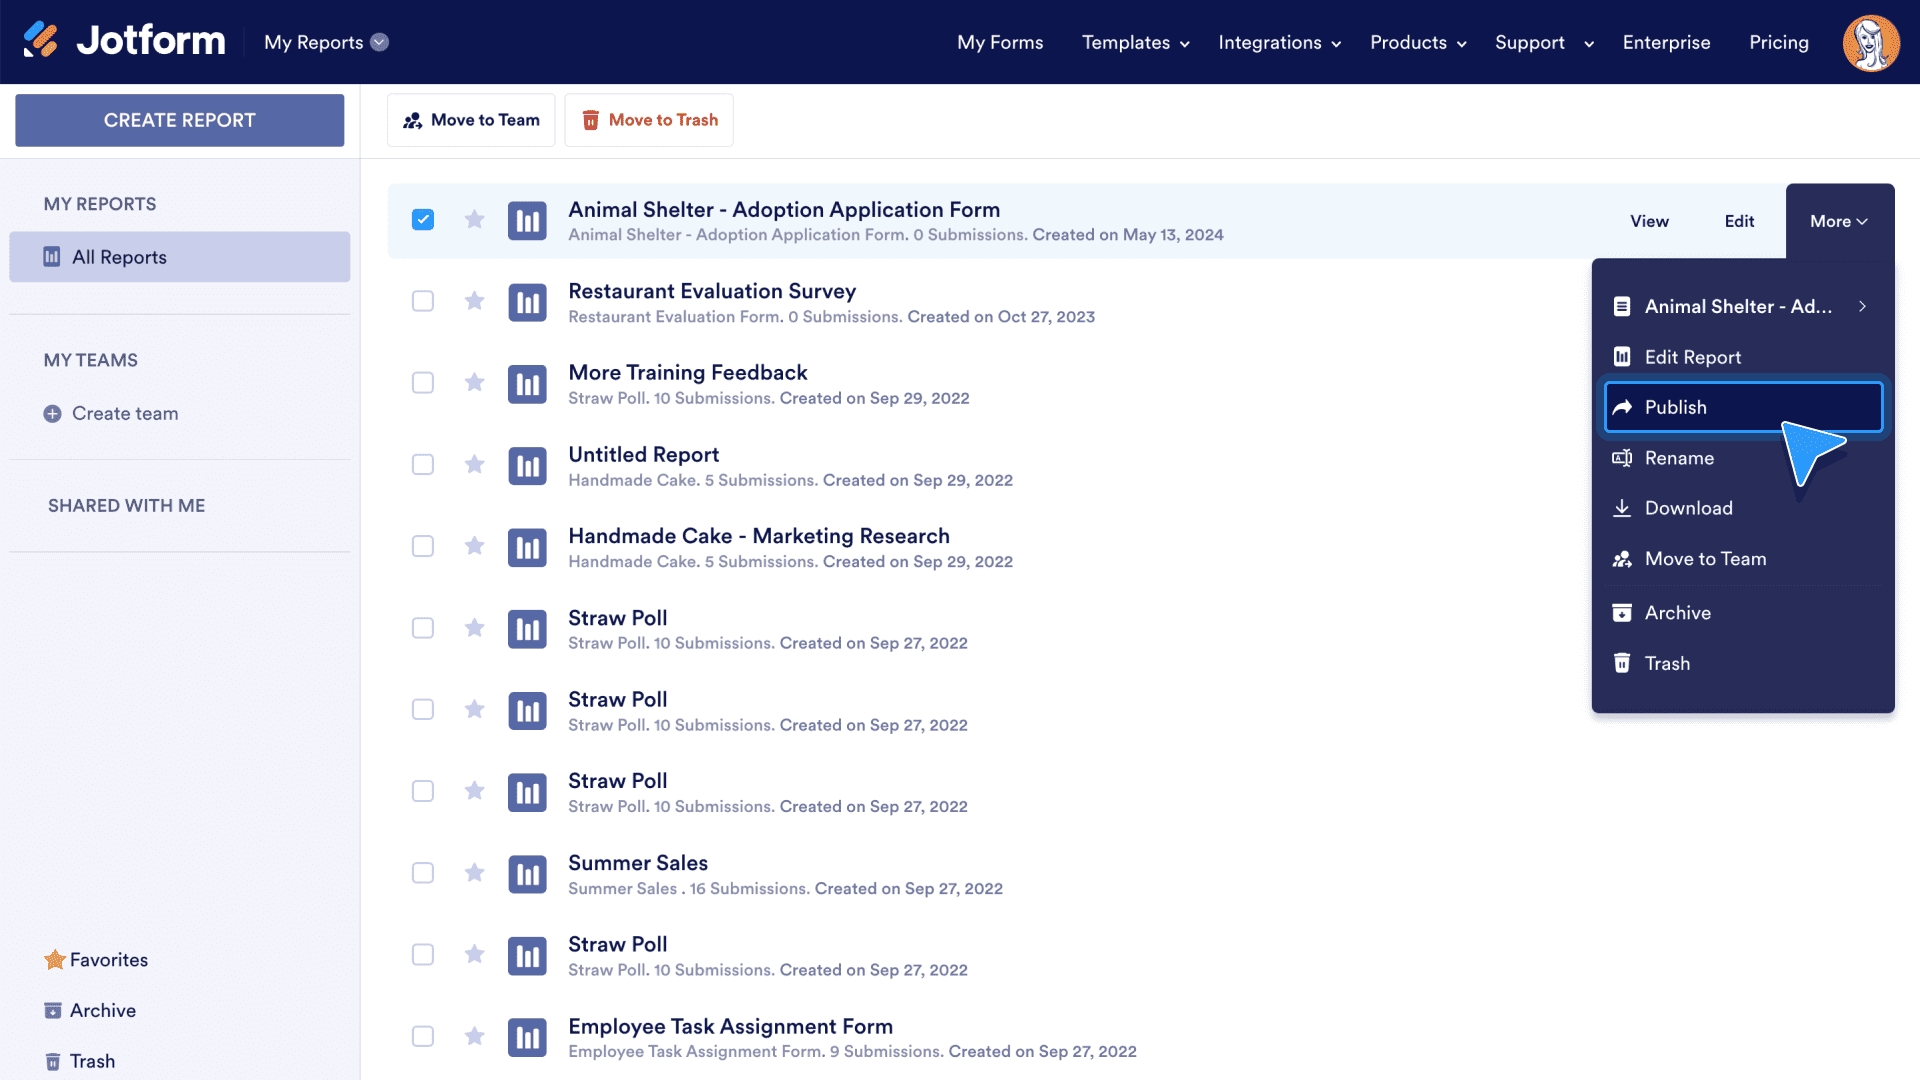
Select the form you’d like to report on and go to the More dropdown menu. In the Data section of the menu, select the Create Report option.
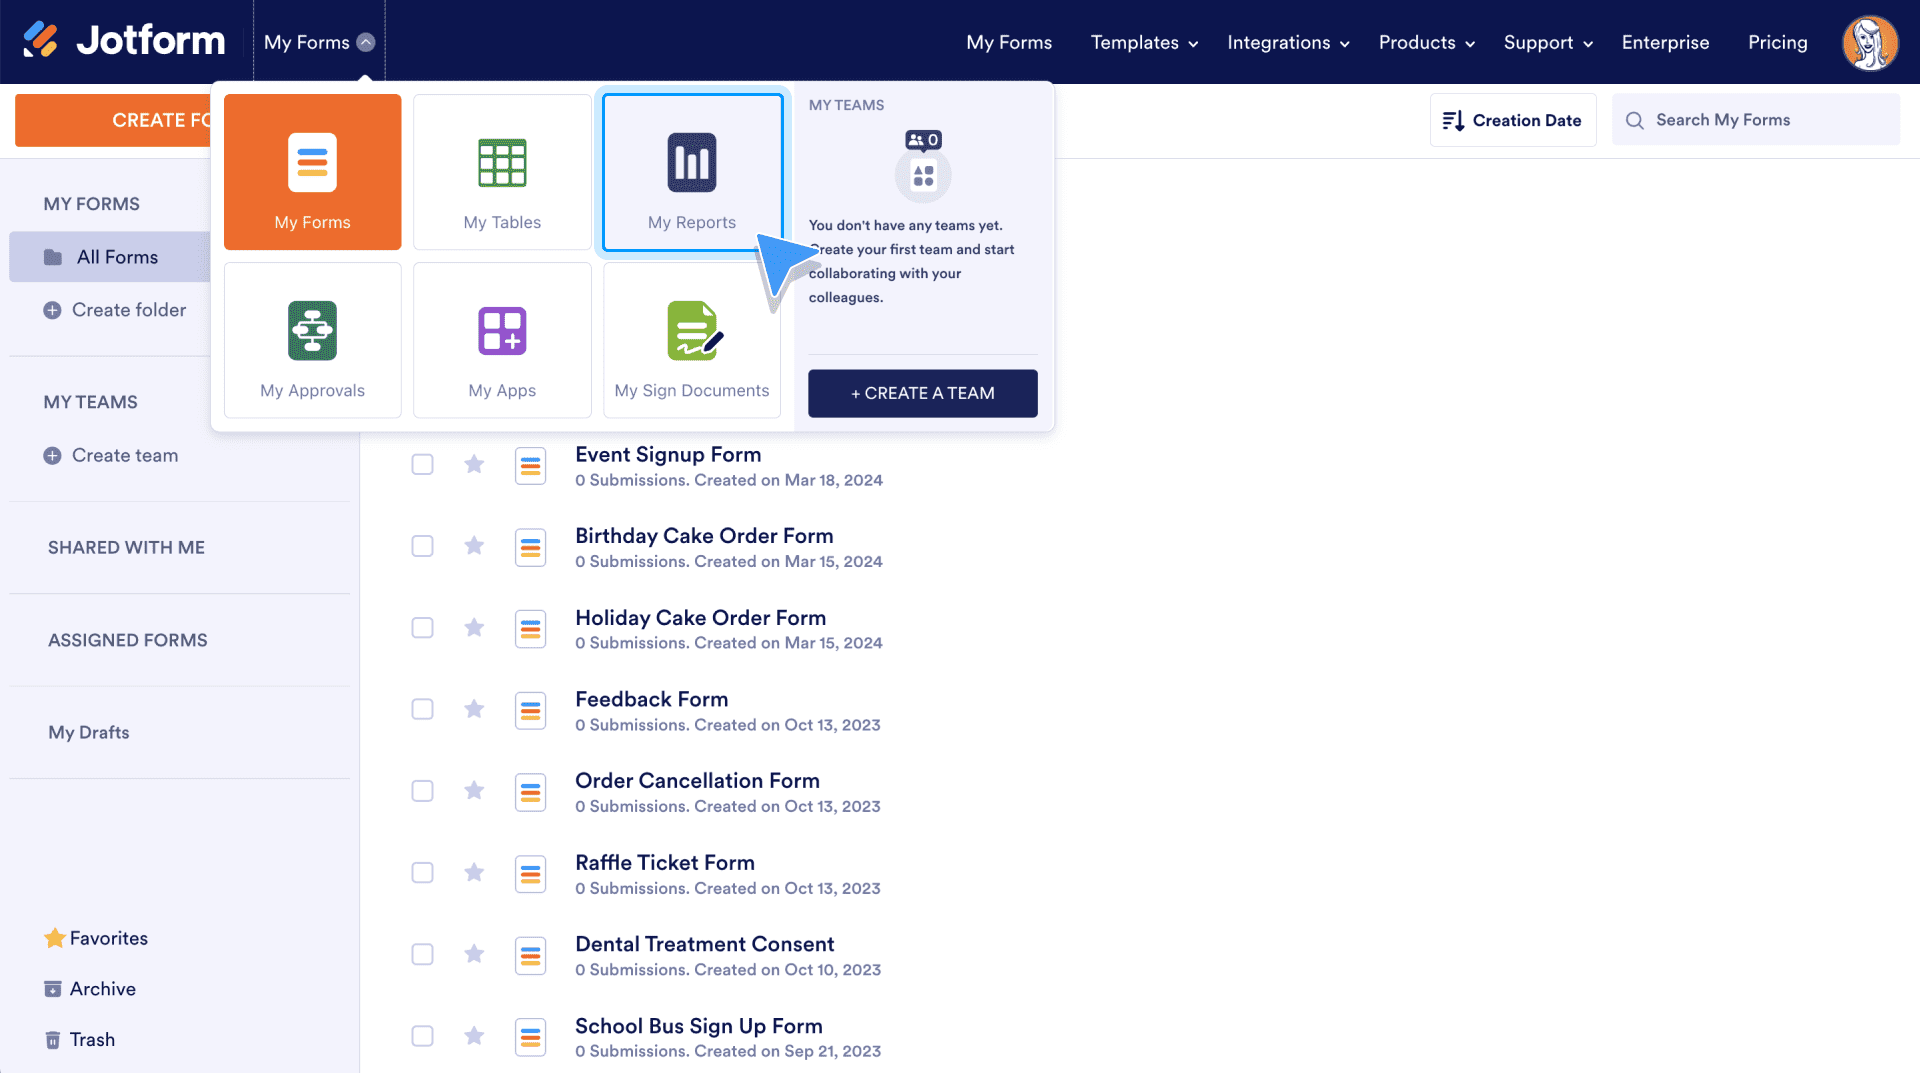
Alternatively, go to the My Reports page and select Create Report. Since this method doesn’t start with a form, there are options for uploading data from a CSV or Excel file to create a report.
Next, indicate how you want to display your data. Just like Campbell and the Santa Barbara Zoo, we’ll create a visual report.
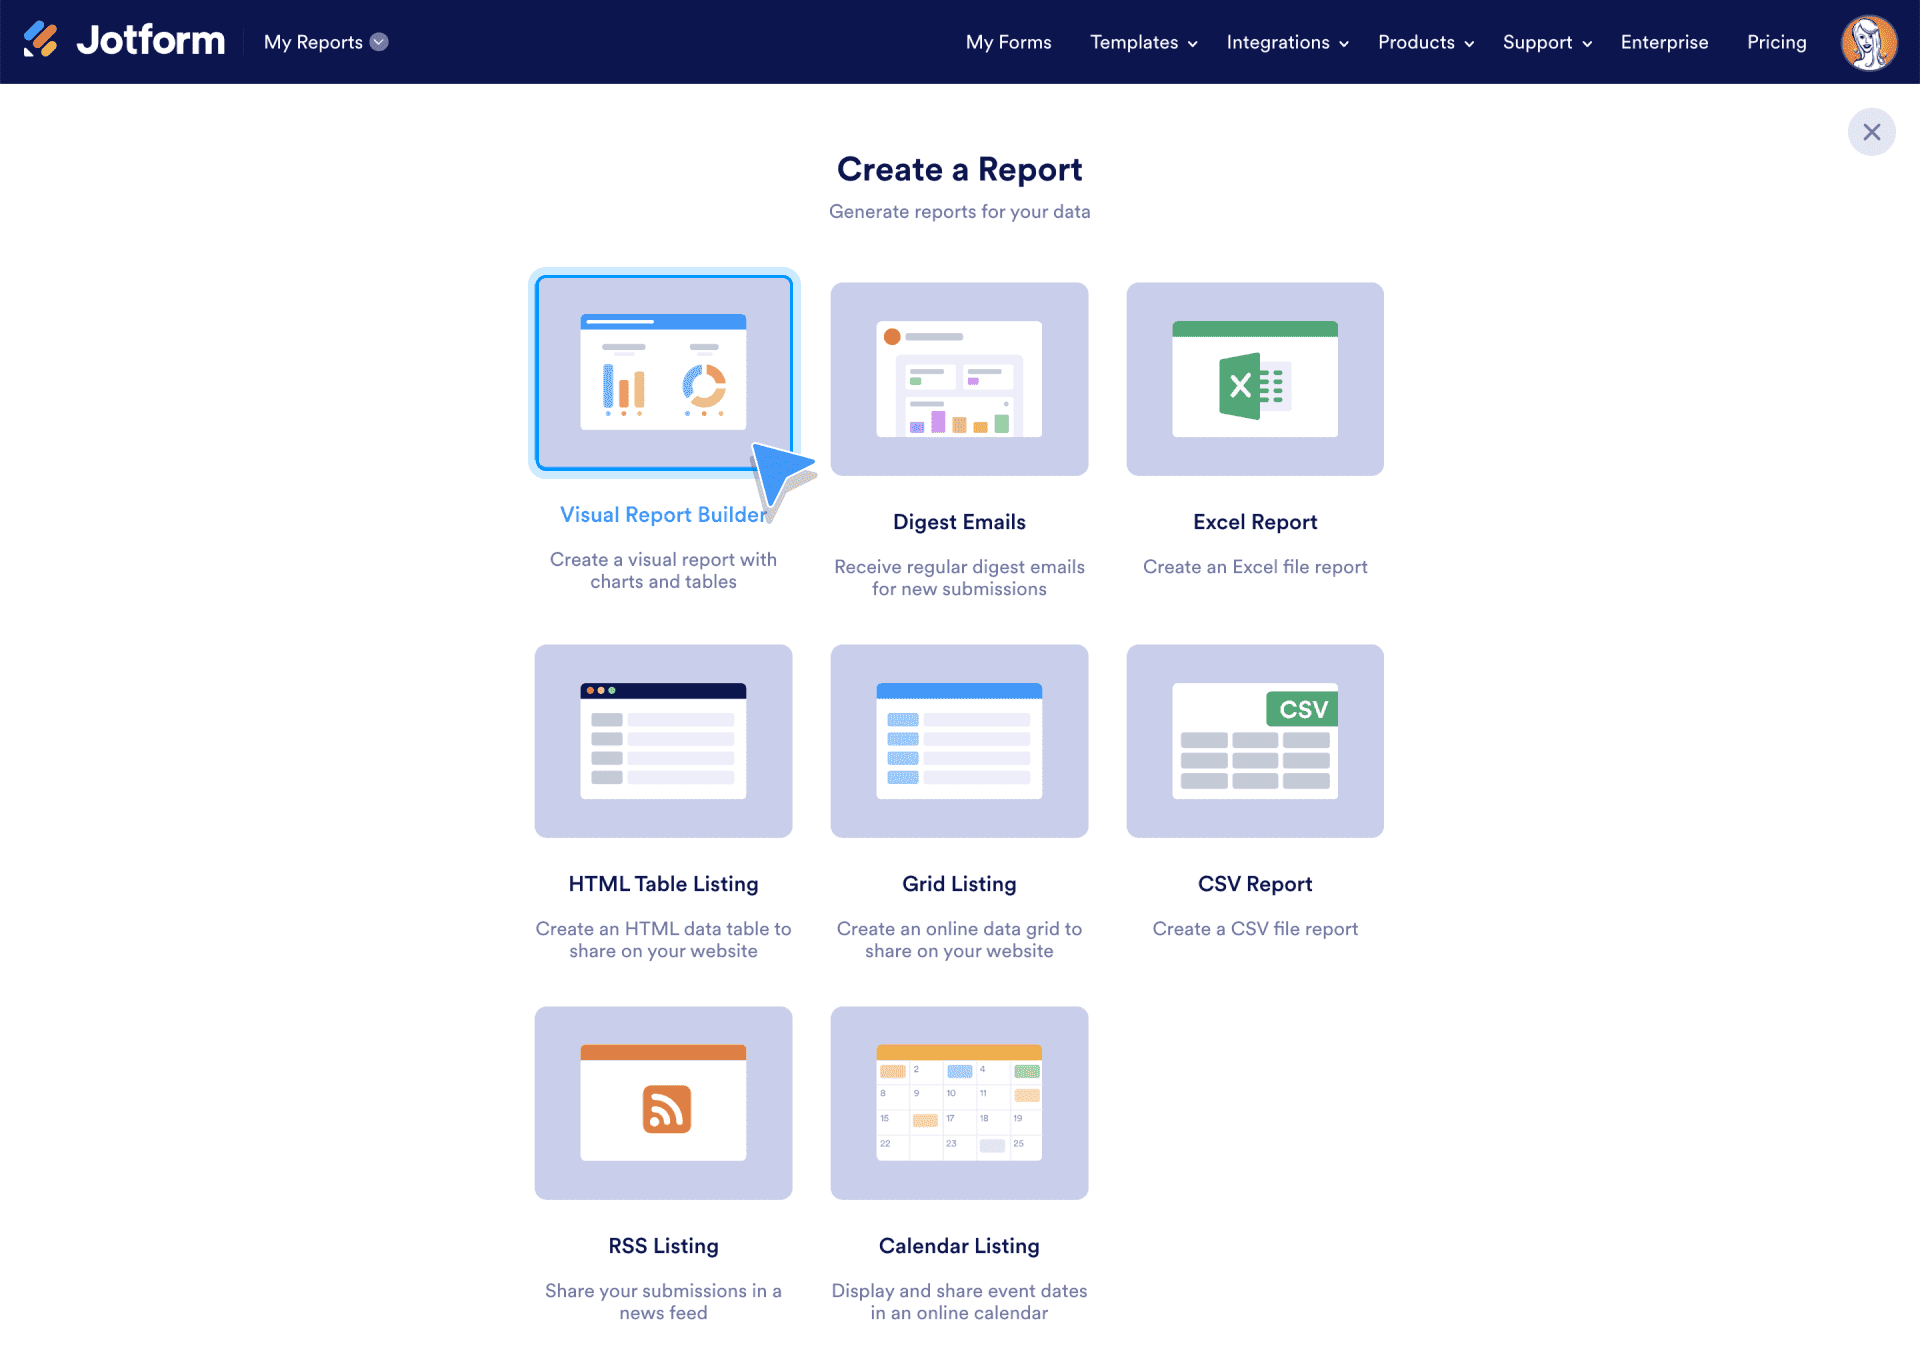
After selecting visual report as the report type, choose the Select a Form option to create a report from submission data.
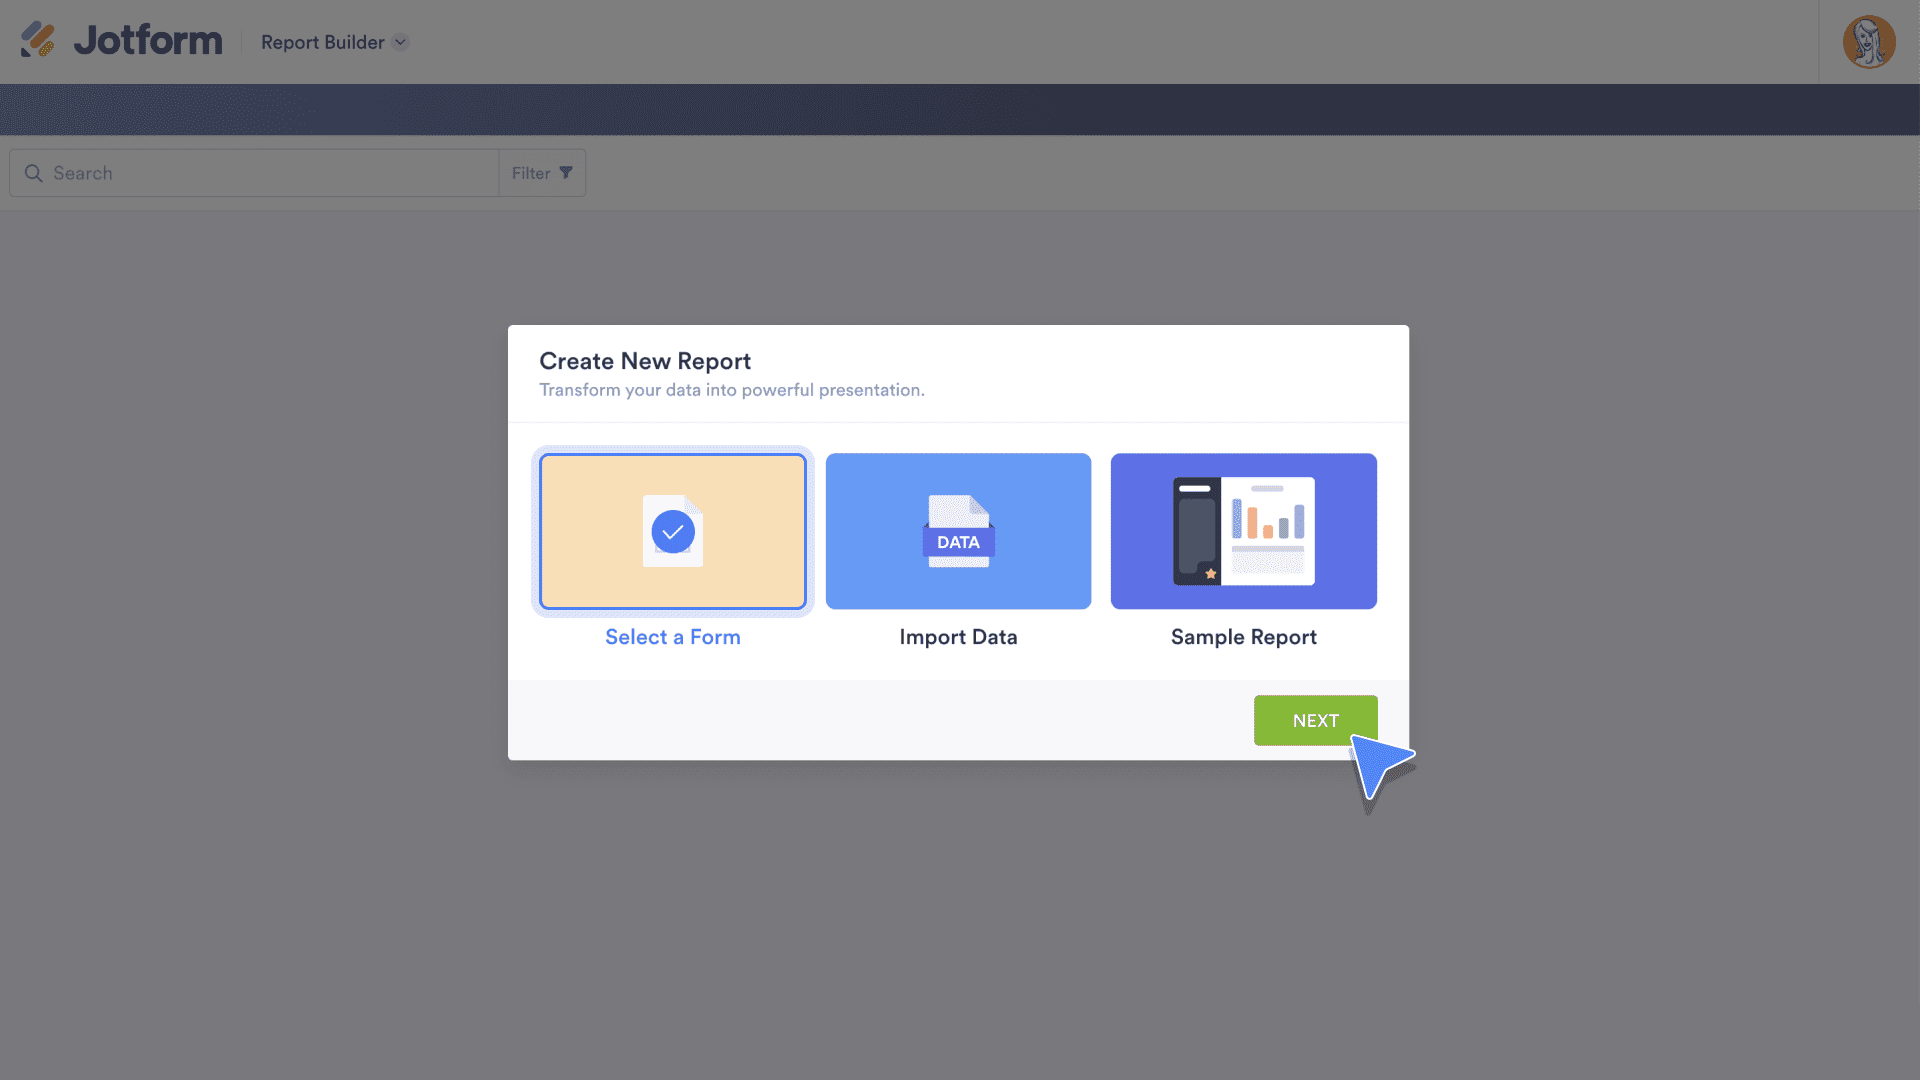
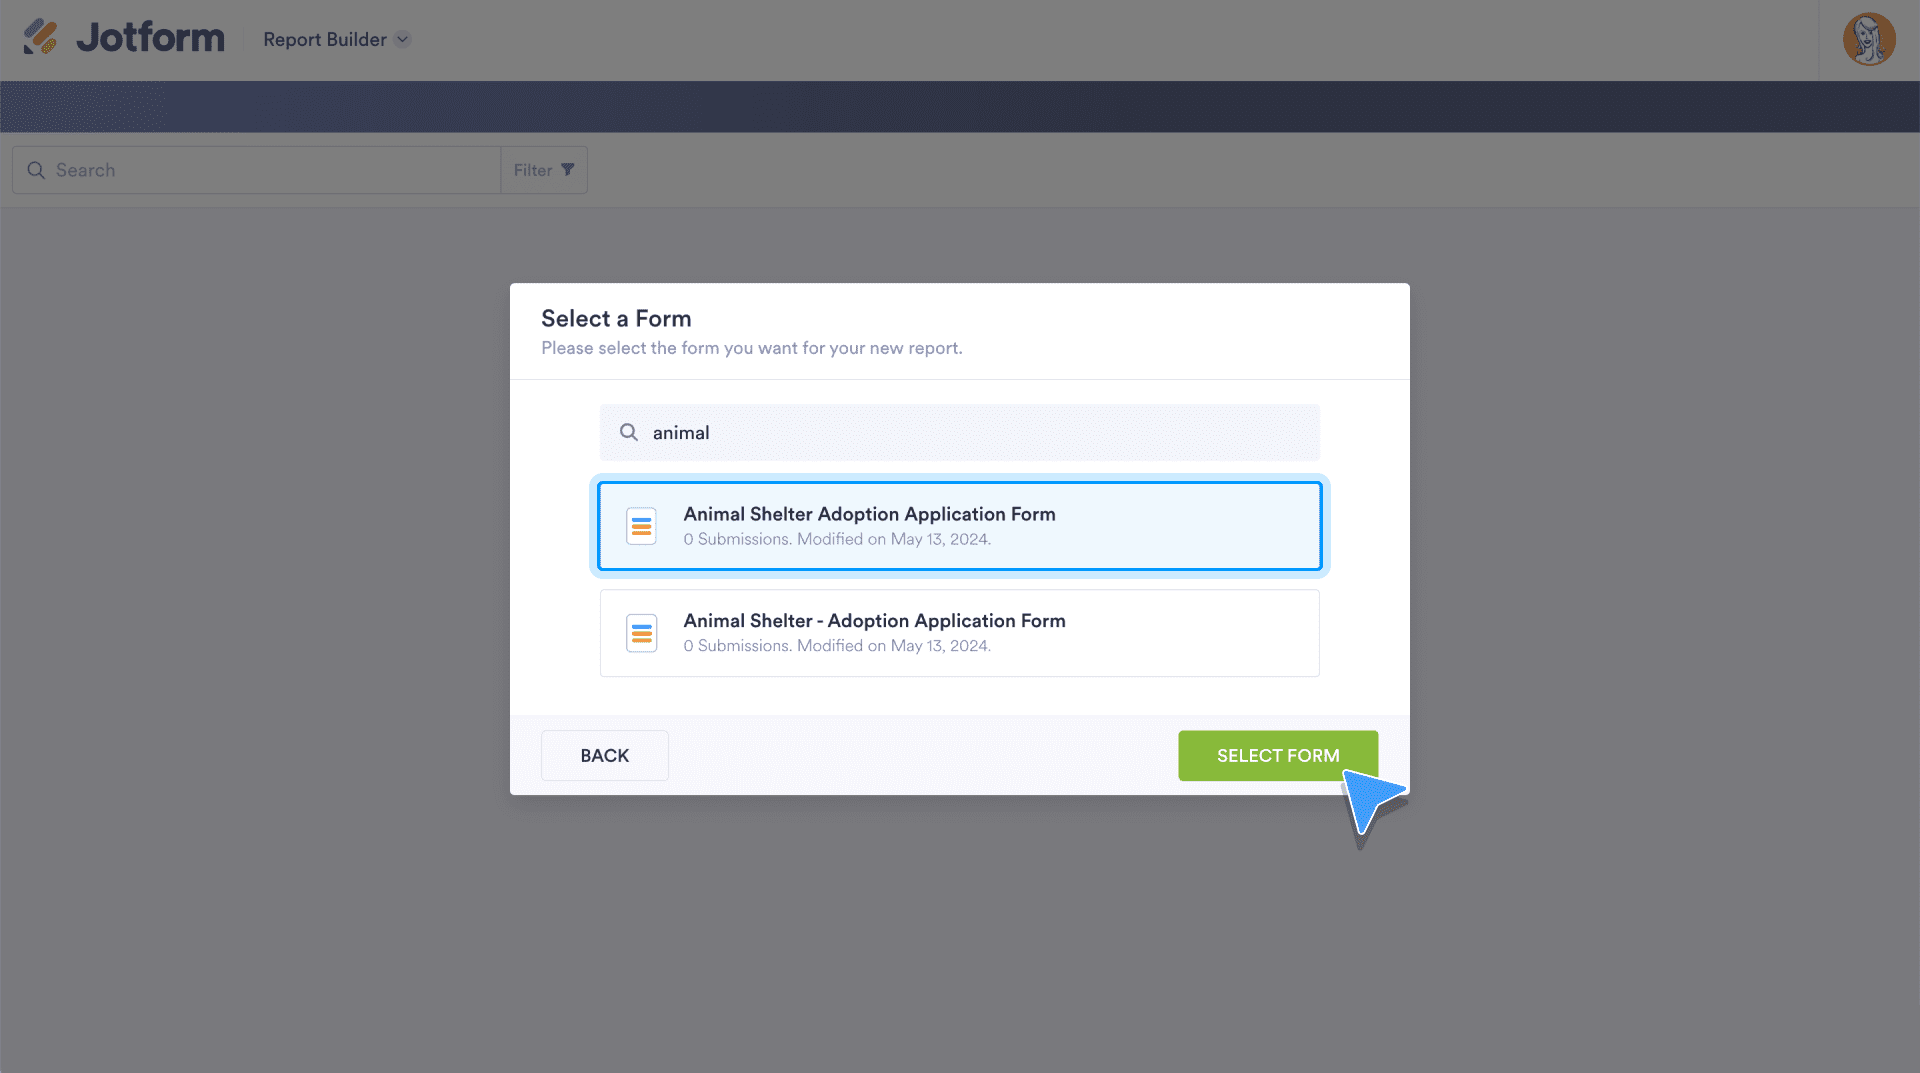
On the following screen, choose the form you want to use from your Jotform account and click Select Form to continue.
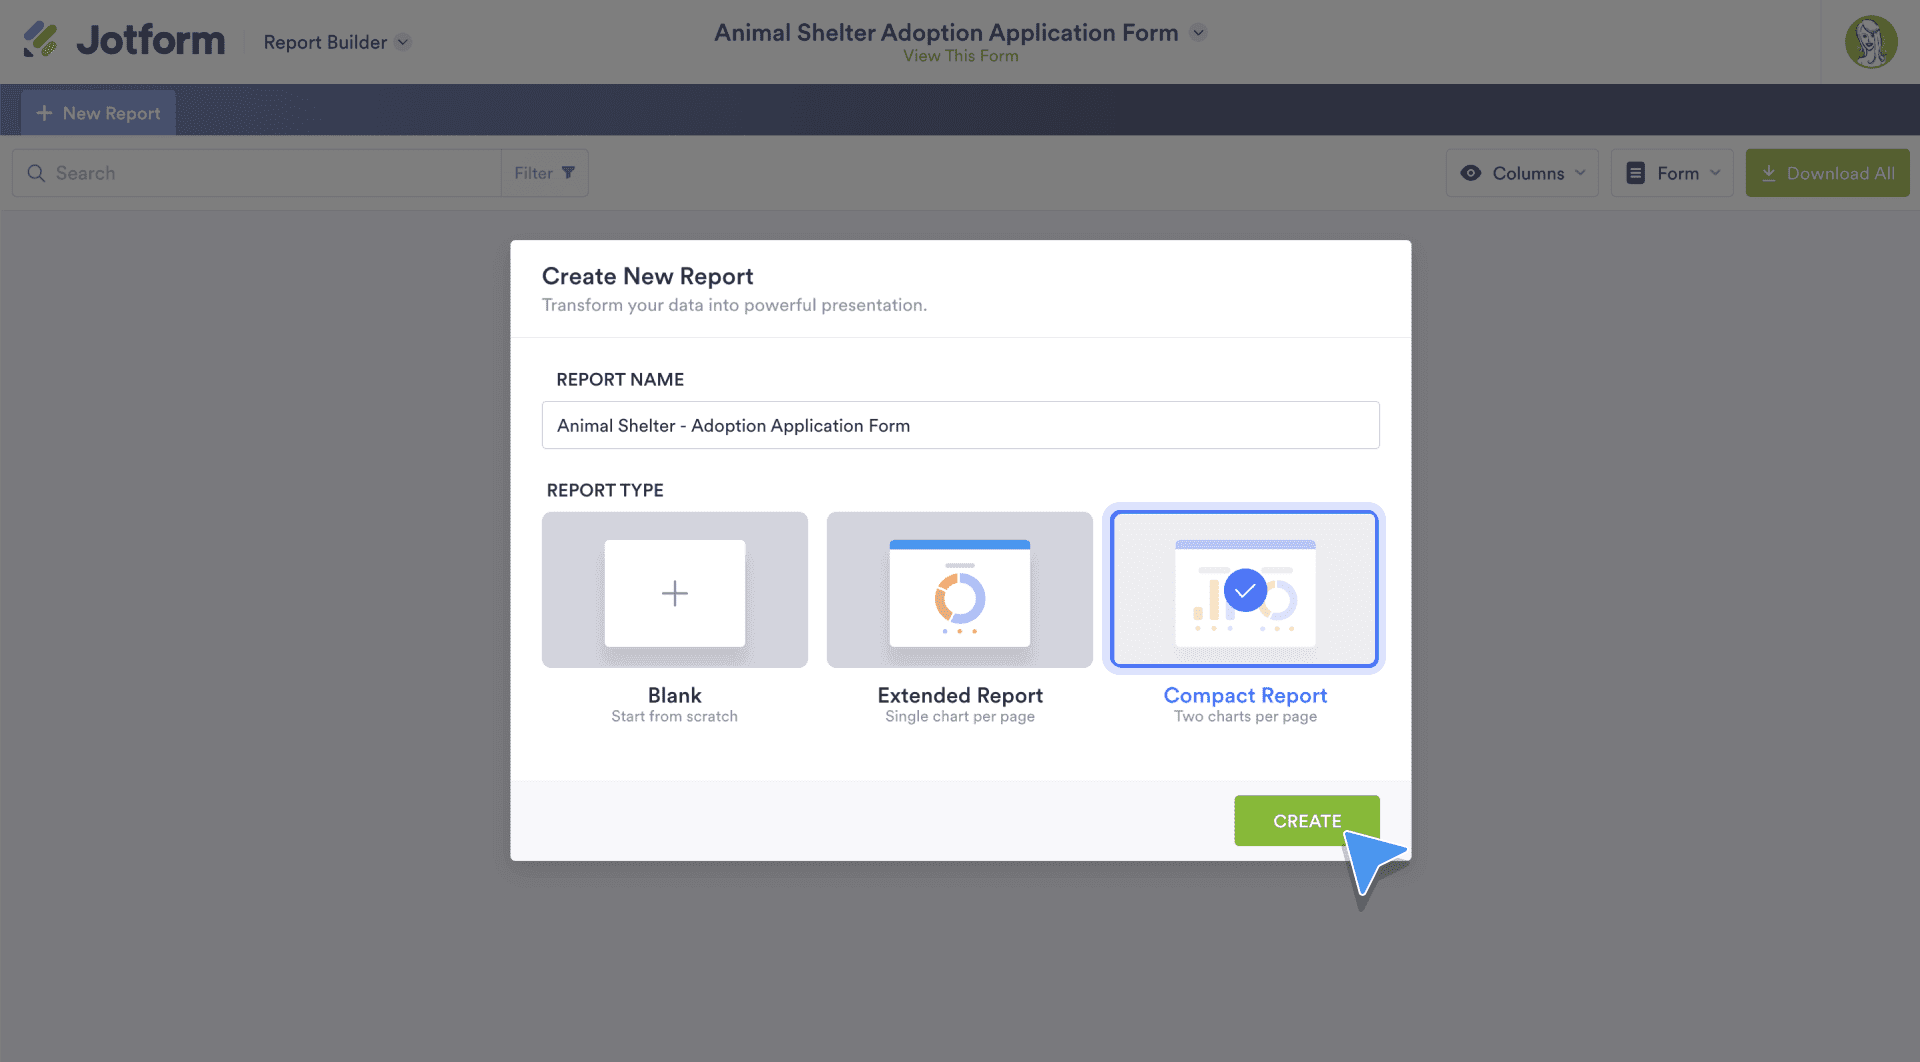
Enter a name for your report in the space provided on the next screen. Then select Extended Report to display a single chart on each page of your report, or Compact Report to display two charts per page.
Select the Blank option to create a report that you can customize from the ground up using data from your form. Each of these three options is fully customizable, from color scheme and branding to a variety of chart styles and design elements, and it’s all easy to alter with drag-and-drop functionality.
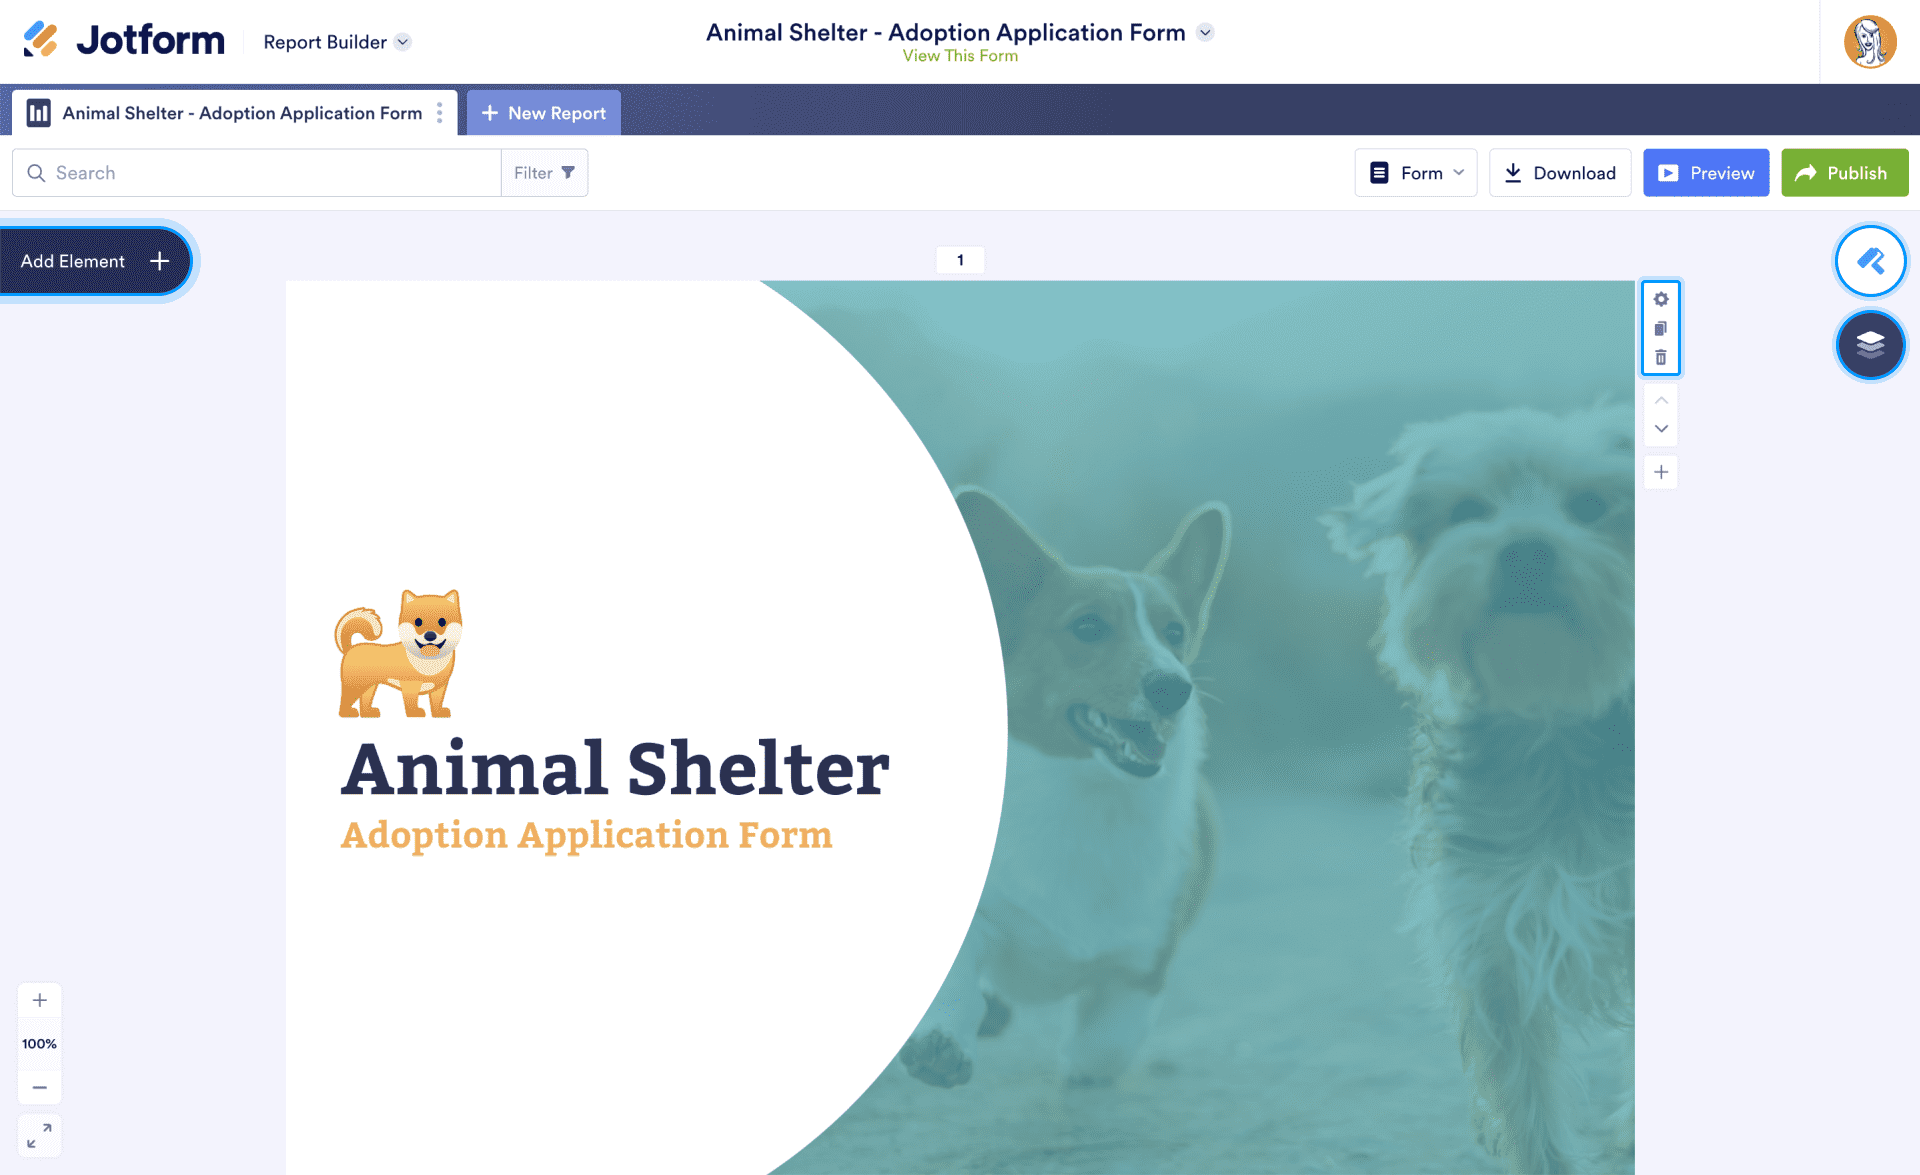
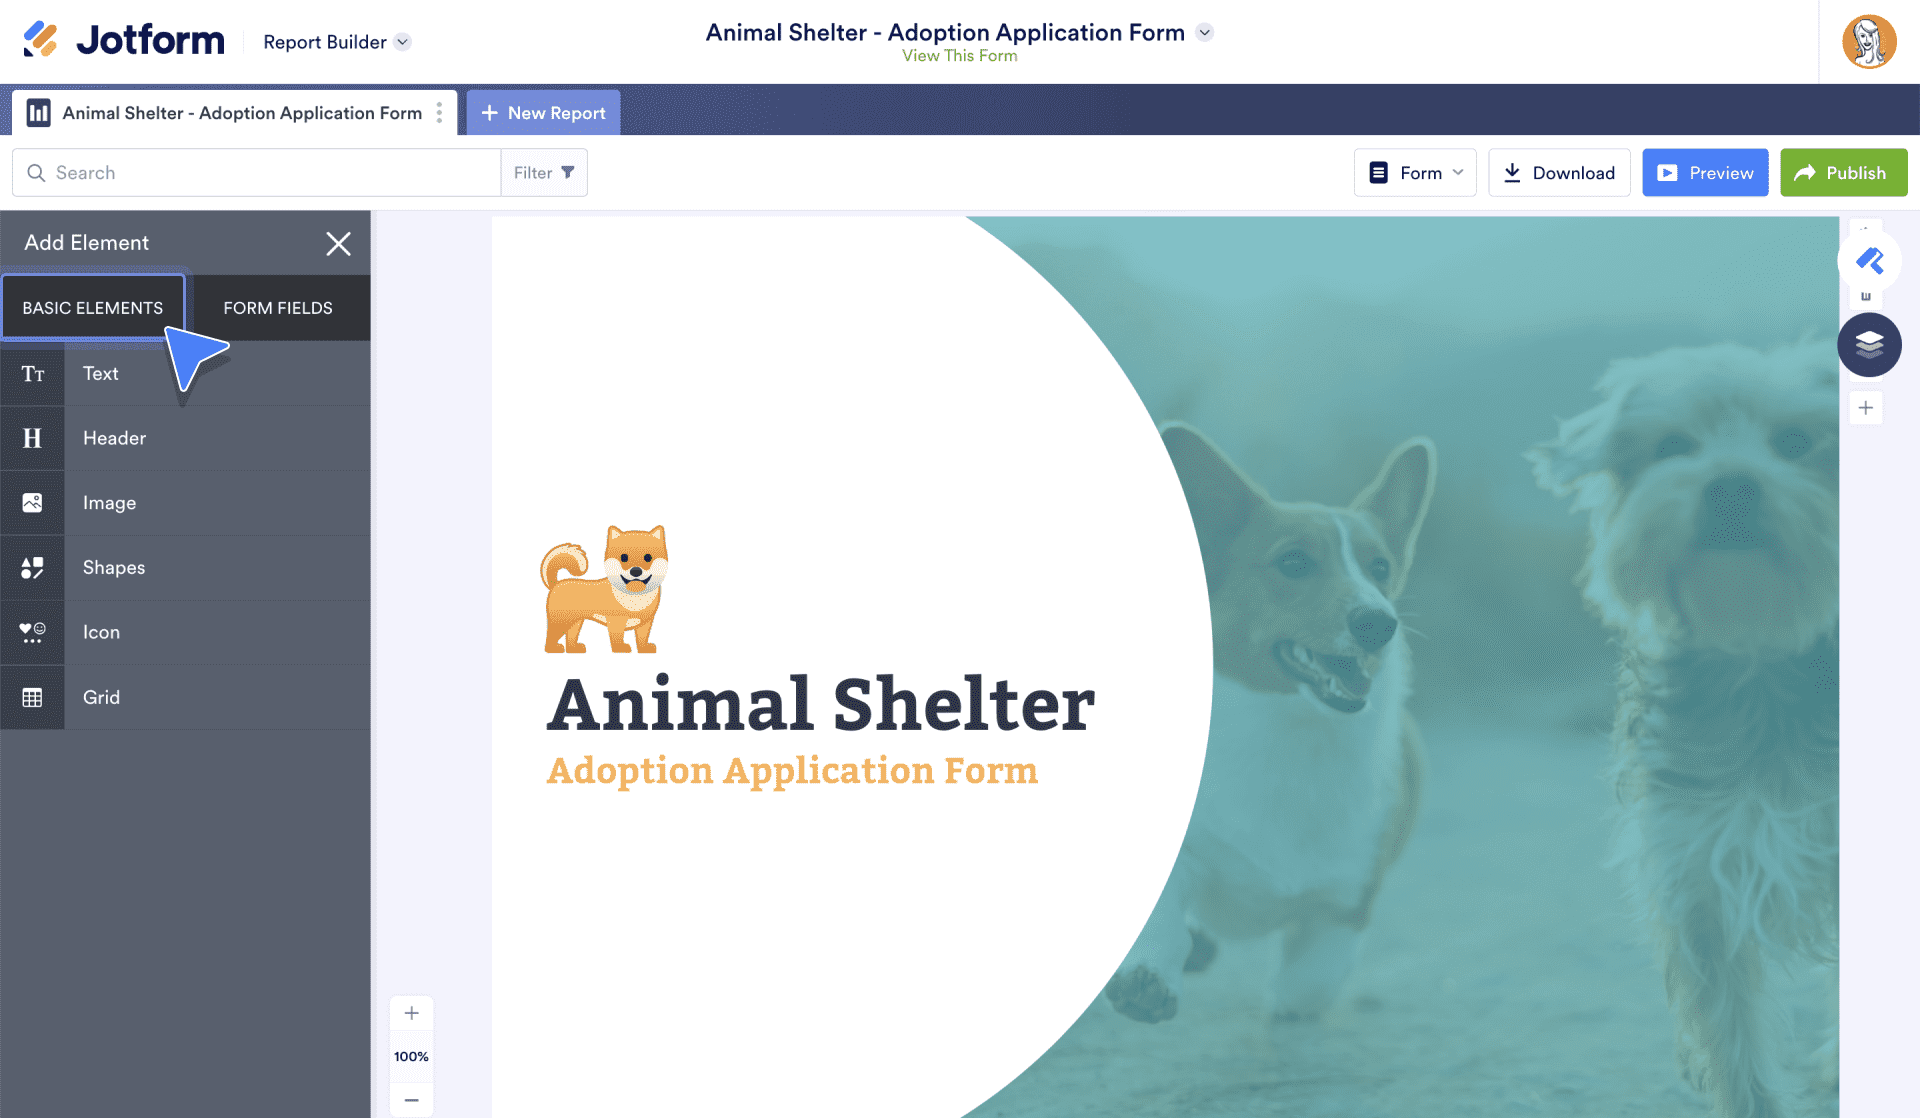
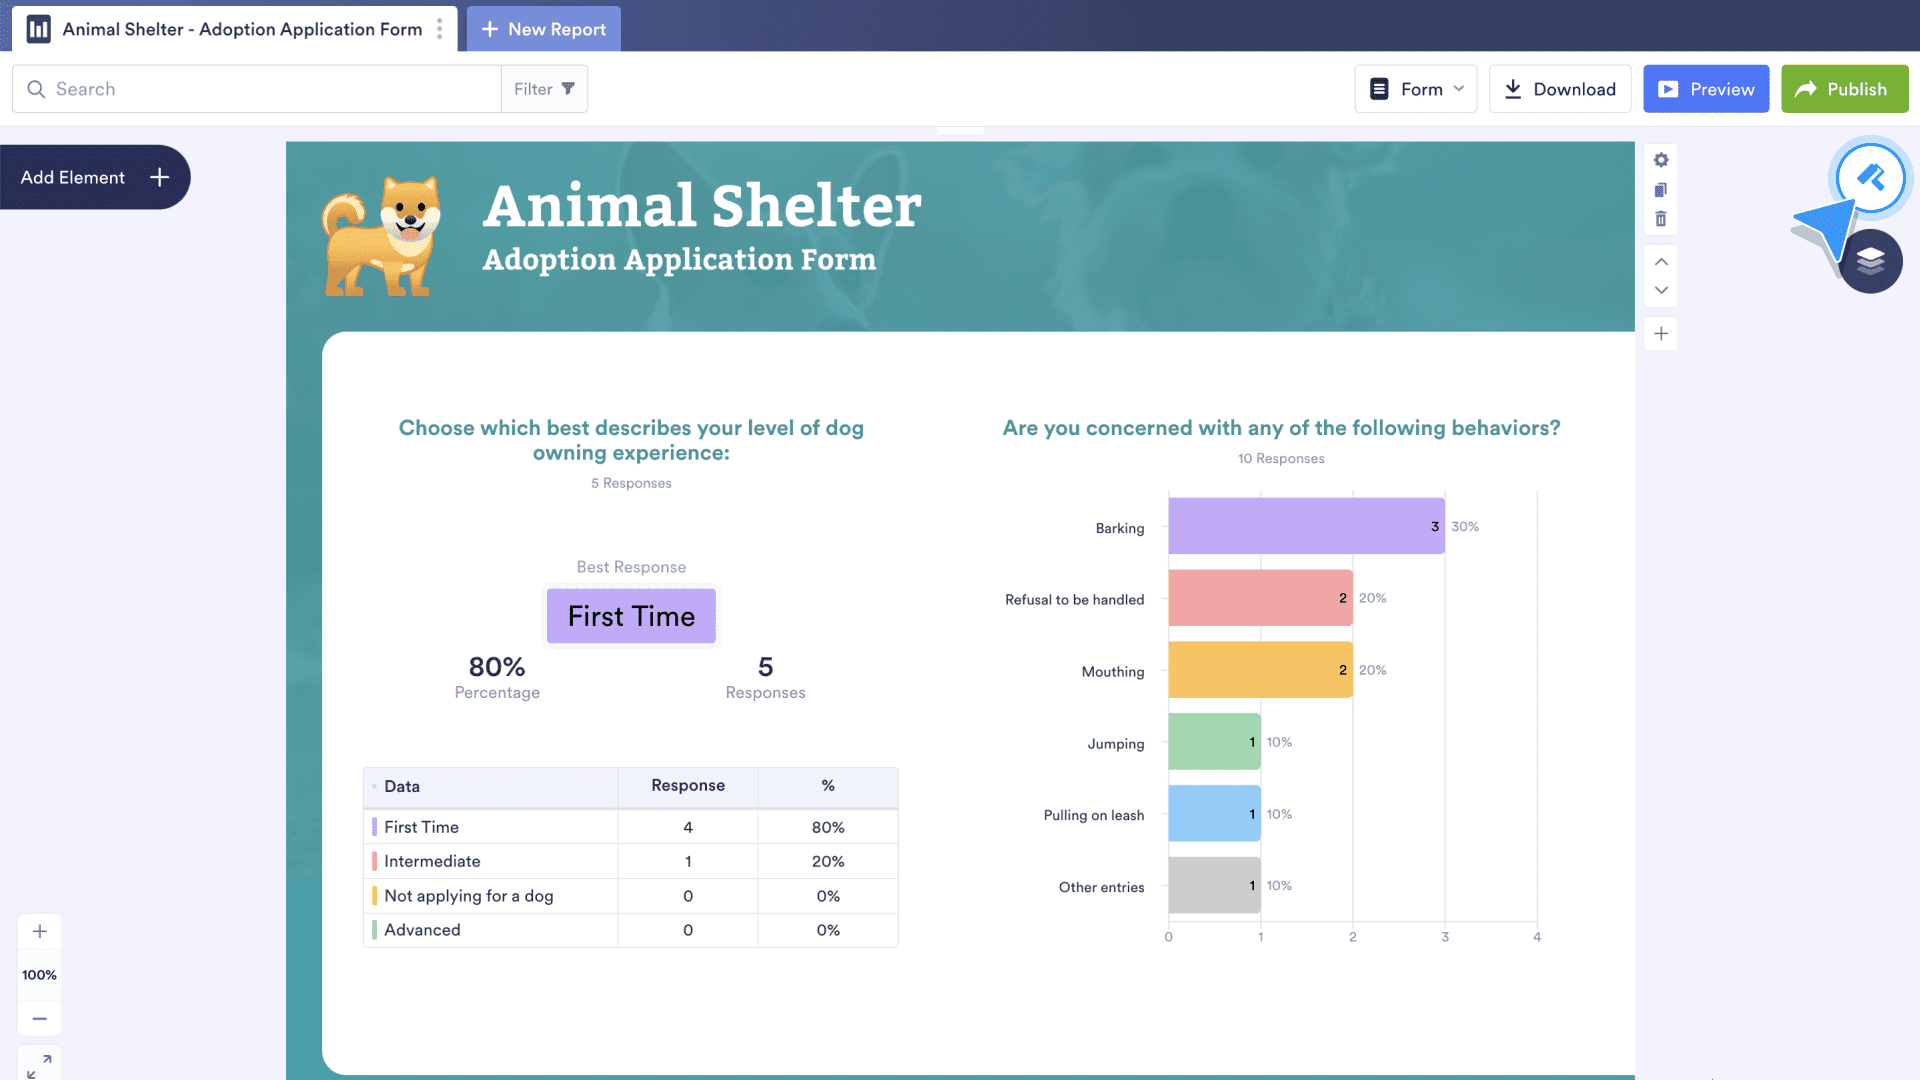
Your report will open with a customizable cover page. The Add Element button on the left opens a menu that contains six basic elements: Text, Header, Image, Shapes, Icon, and Grid. This menu also lists all of the form’s fields. Each Form Field element creates a customizable chart populated with submission data.
On the far right of the screen, a paint roller icon reveals Layout Settings, including custom color schemes. The slide deck icon below the paint brush will display your slides all at once for easy navigation. Each slide has its own settings menu, accessible from the gear icon to the right of the slide. Below the gear icon are options to duplicate or delete the slide, move the slide up or down, or add a new slide.
Pro Tip:
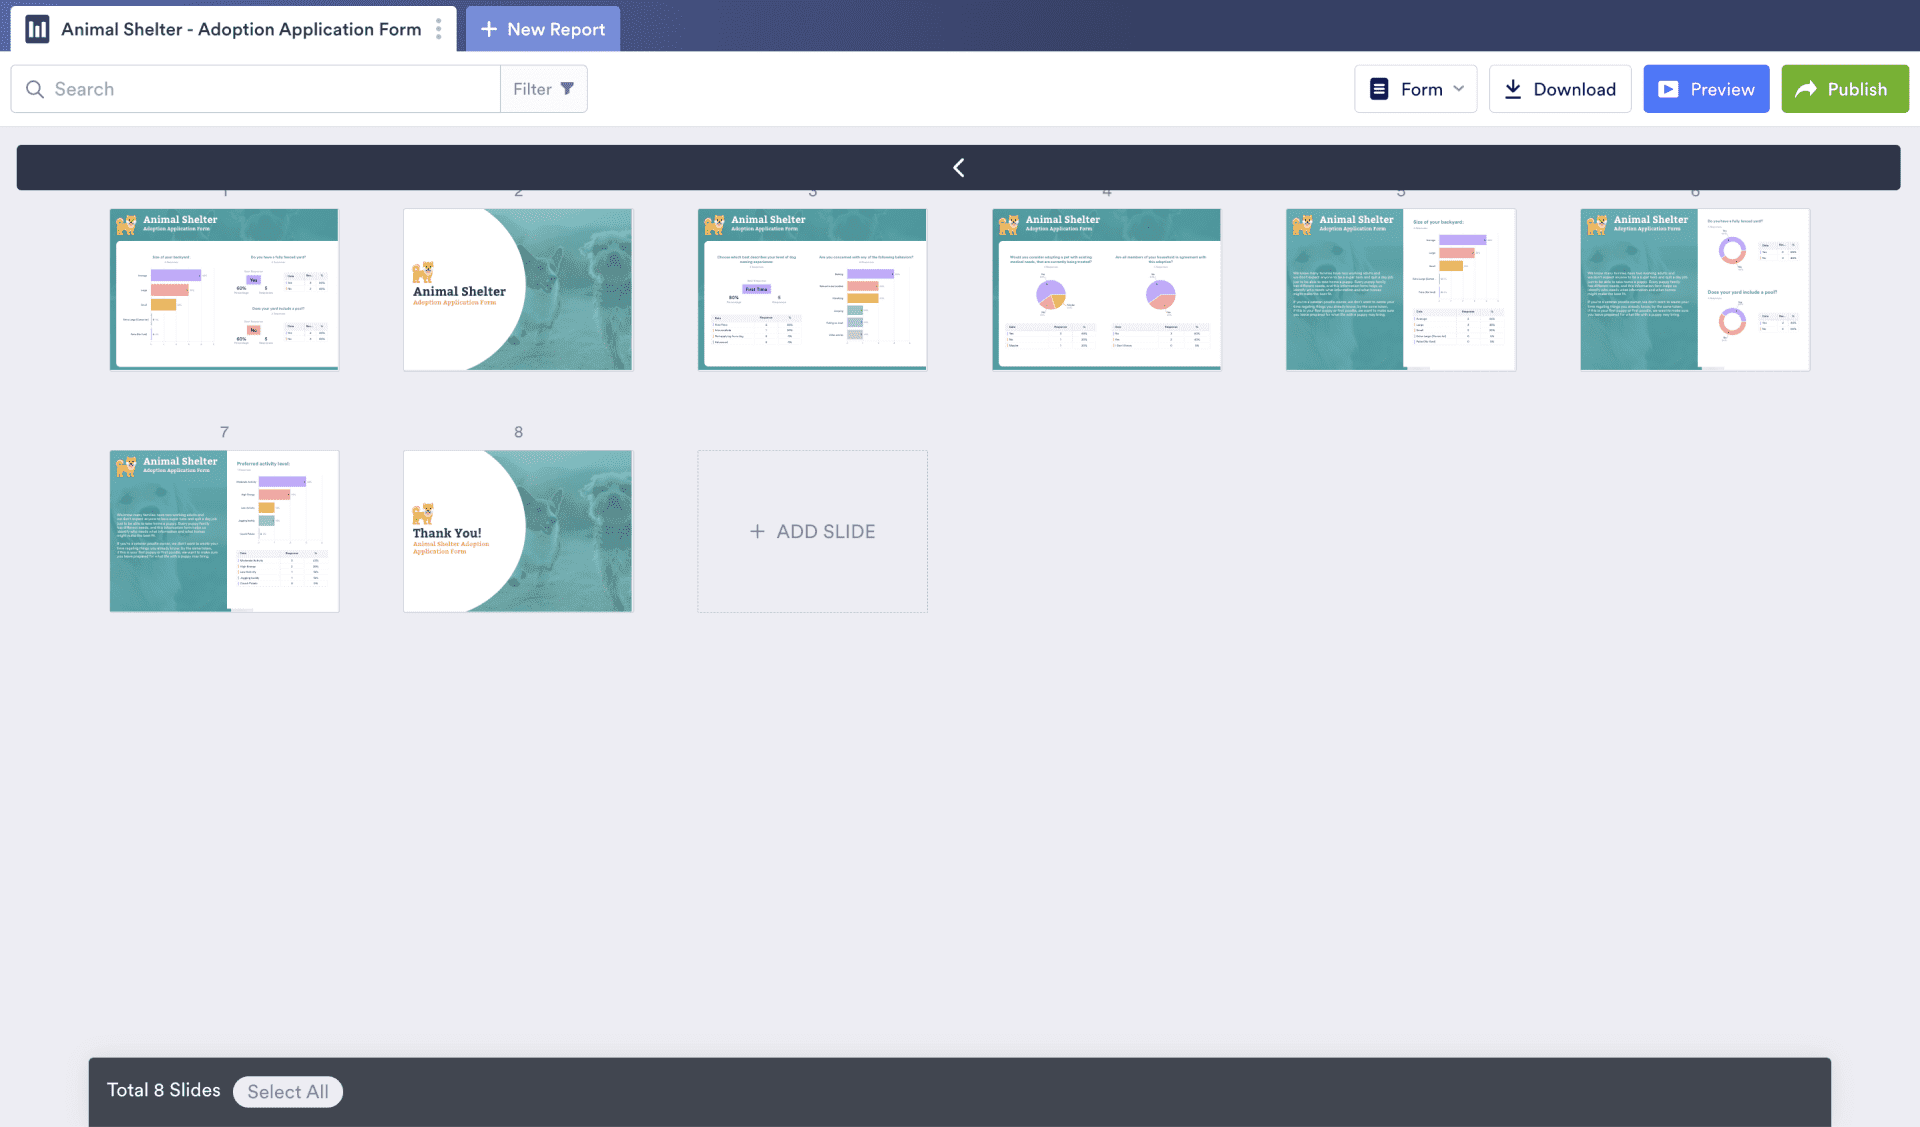
Want to take a macro view of your report? To view slides vertically, click the slide deck icon below the paint roller icon on the top right portion of the screen. To go a step further, click the Show All button.
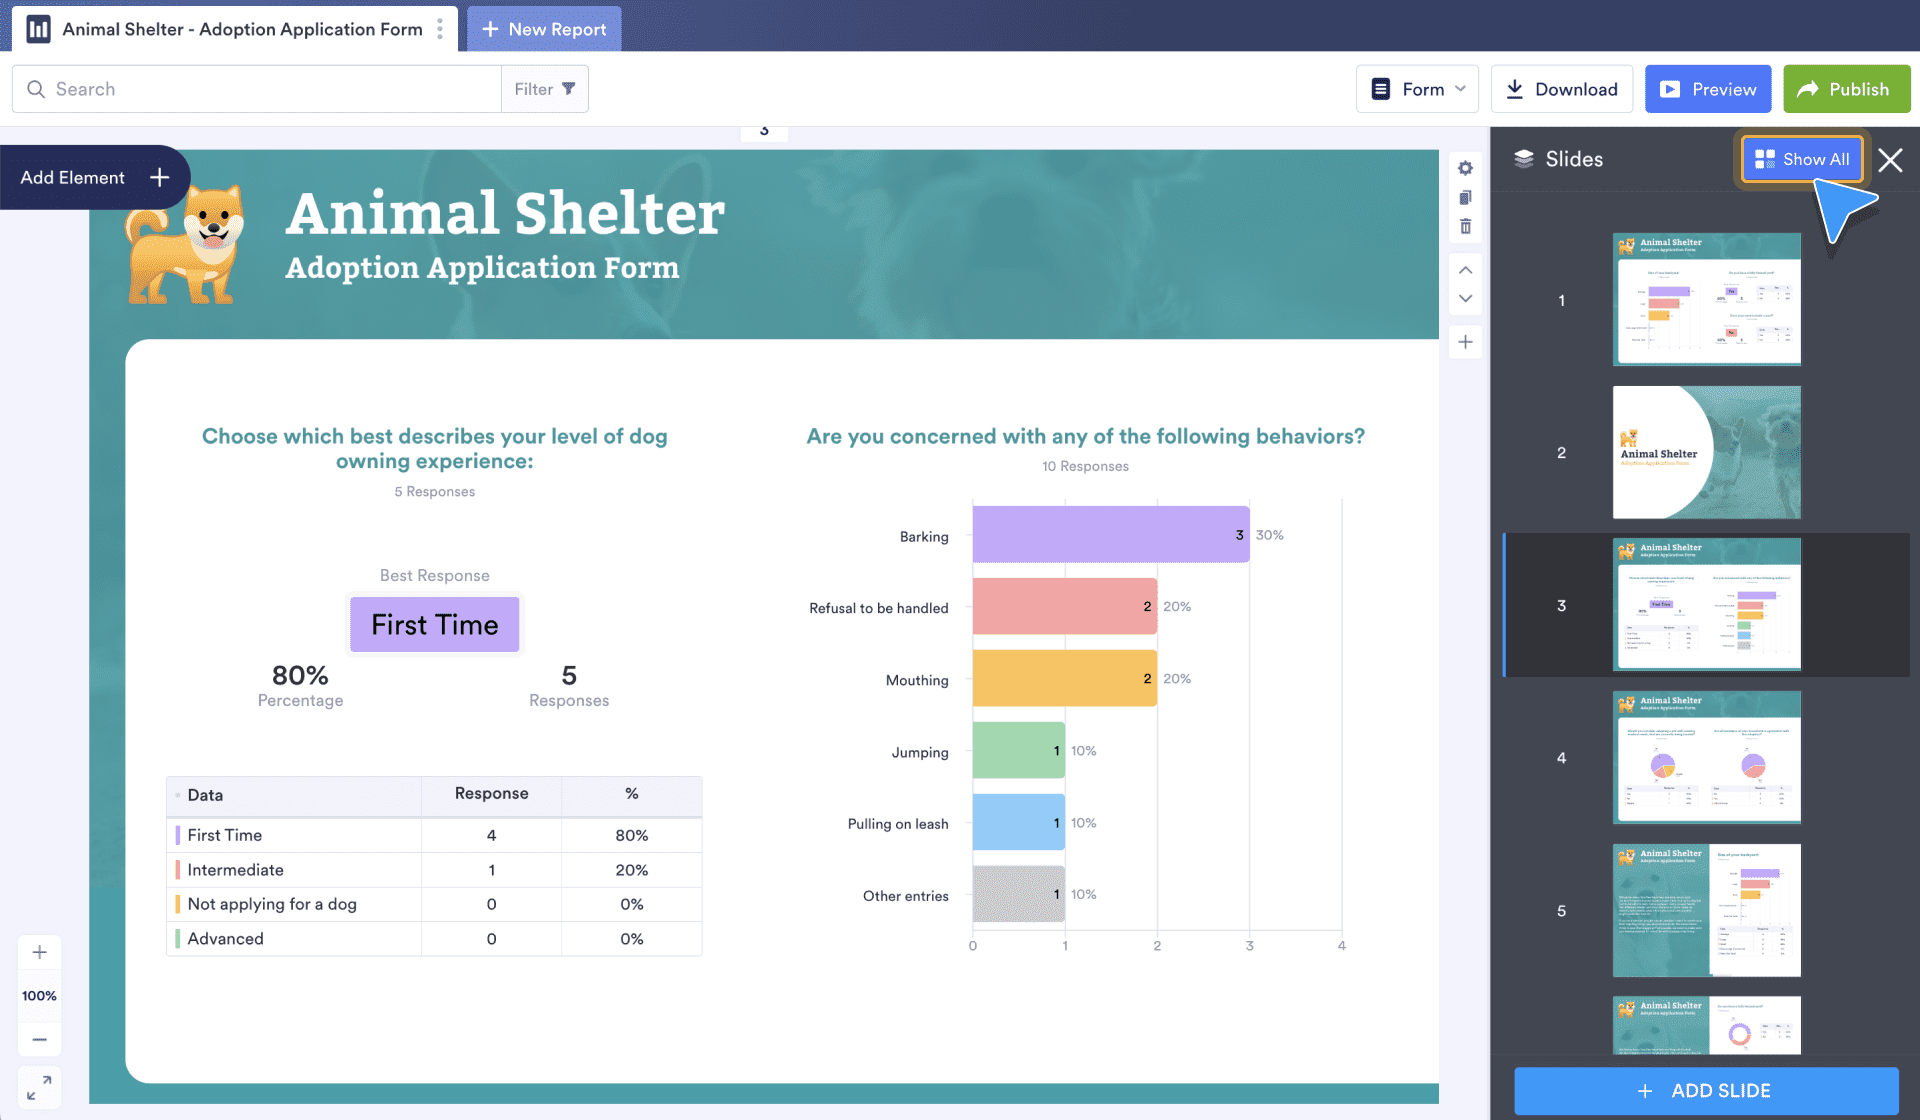
The Show All button does what it claims: All of the report slides are displayed on their own page, providing a much wider view than the vertical view allows. Plus, Report Builder functions like Preview, Publish, and more are available from this view as well.
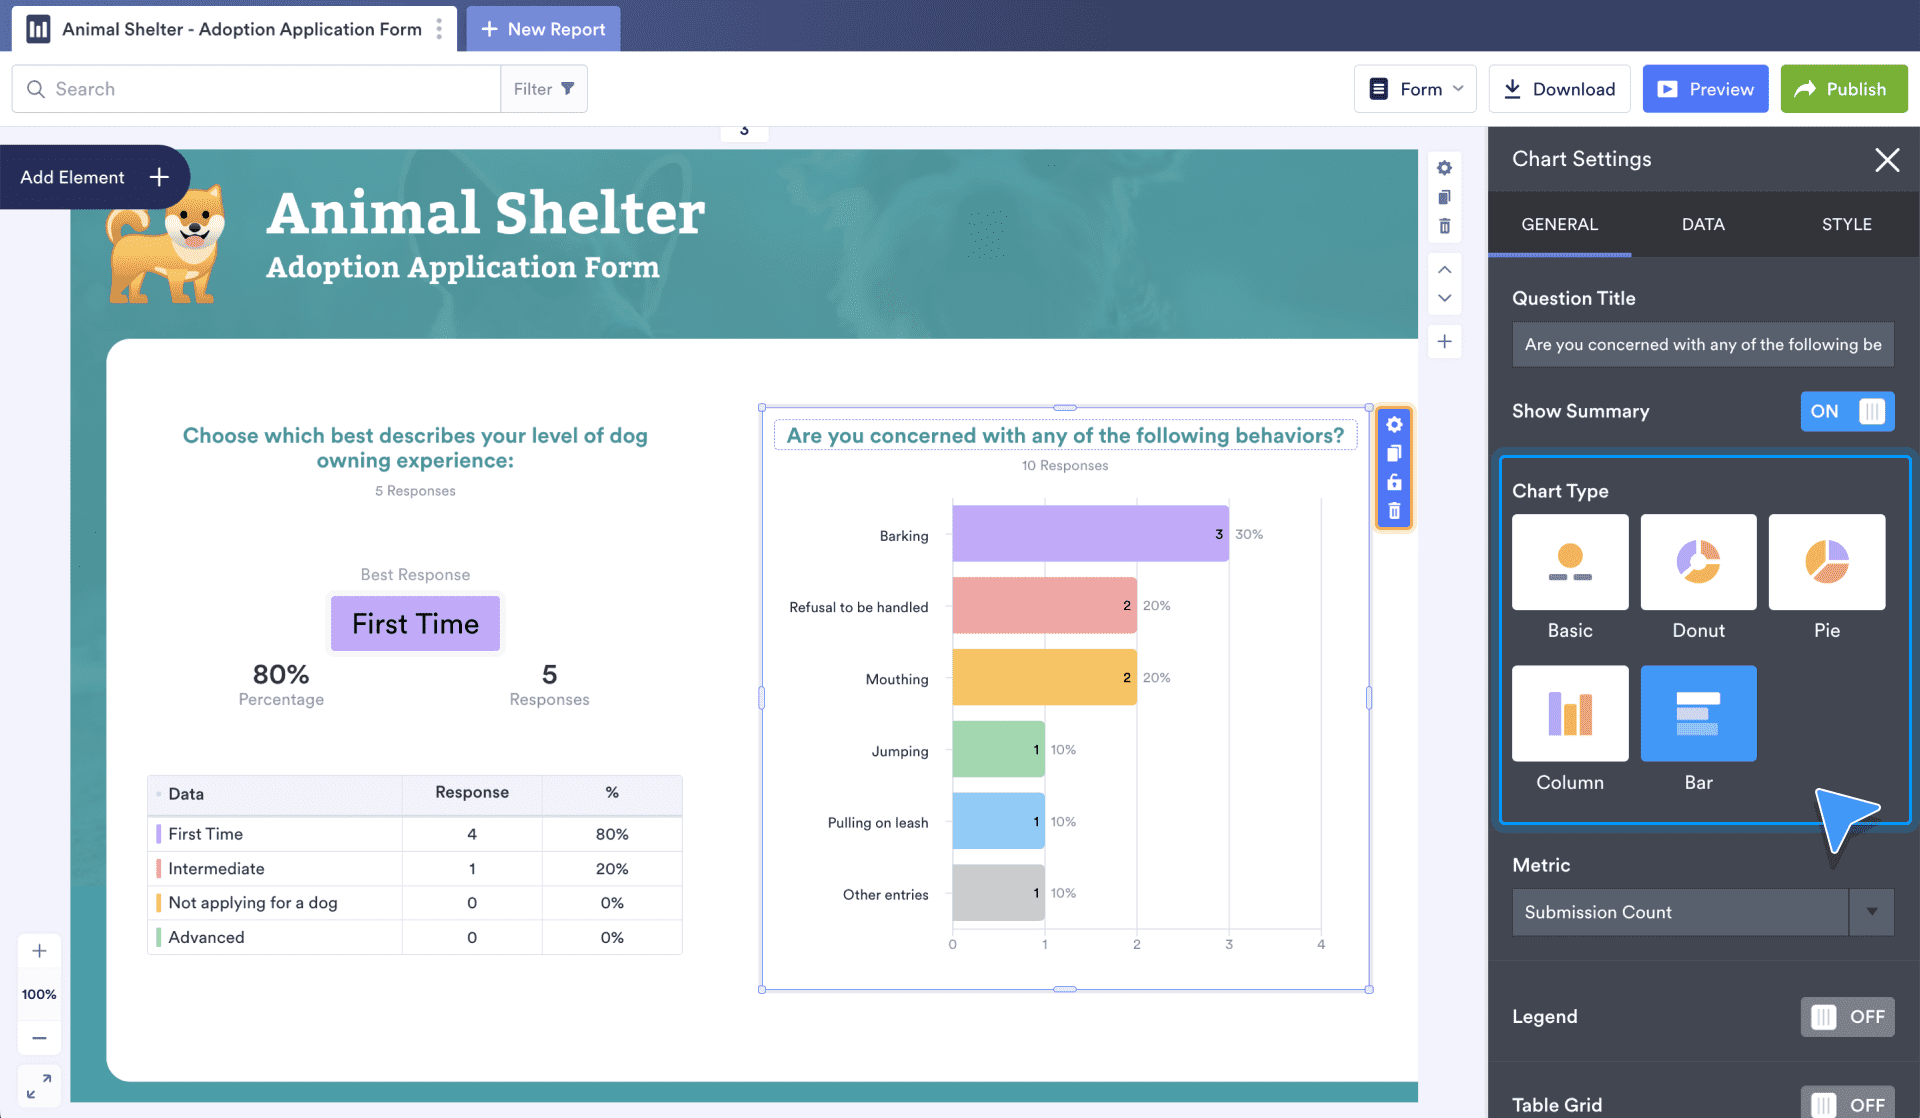
On the slides shown next are customizable charts that display submission data. Click on the chart to access the Chart Settings. There are a plethora of options, starting with the General tab. This is where each Chart Type can be customized.
Beyond visual reports
Jotform Report Builder possesses a noteworthy depth of functionality. The Visual Report Builder alone contains myriad possibilities for data visualization and customization, as this chapter illustrates. But there are several more ways to create a report with Jotform. Choose any of the following options from the Create a Report page to get started.


Excel Report and CSV Report
If you collect a lot of numerical data, it might be a good idea to create Excel or CSV reports. You can open these types of reports with Google Sheets, Microsoft Office, Libre Calc, and any other Excel alternative.
In the Report Builder, click Excel Report or CSV Report, select your form, and indicate which fields you want to include in your report. You’ll receive a link to the report and an option to download it.


HTML Table Listing and Grid Listing
HTML table and grid listing reports are great when you want to present your data in a simple table format. You can embed both of these report types into your website, where submissions will be displayed as soon as they’re submitted.
When creating your report, click either HTML Table Listing or Grid Listing. You’ll then receive a report link, iFrame code to copy to your own website, and the option to open the report directly.

RSS Listing
Creating an RSS Listing report for your form can be helpful because you’ll receive your entries in a newsfeed-type format. Click RSS Listing, and you’ll receive a link to your report. Note that because your RSS report will be in XML format, you’ll need access to an RSS reader. Luckily there are free ones online for you to use.

Calendar Listing
If you use your forms to book appointments, or you need to know when someone submitted a form, Calendar Listing is the report for you. It’s great for creating a static agenda and quickly building a schedule based on a form.
To create a calendar report, click Calendar Listing. After that, select the form and date fields you’d like to add to your calendar. Click Create when you’re ready, and you’ll get a link to your report.
Note that for the dates to show up properly in the Calendar Listing, your form must include the Date Picker element.
Appointments will show up as different colors; click the date to show the names of your appointments.

Digest Emails
Digest emails provide an email snapshot of submission information from your chosen forms. This is an easy way to get an at-a-glance look at your submissions. To set up digest emails, click Digest Emails and fill in the prompts on the screen.
If you have a Bronze, Silver, or Gold plan, you can send digest emails to up to 10 people. If you’re on the Starter plan, you can only send them to yourself, the account owner.
Once you indicate who you’re sending digest emails to and how often they will receive them, you can select your forms. There’s a search field at the top of the page, so you can easily search for your forms. Click Next, and you’ll see a sample digest email so you can make sure everything looks good before you send it.
Now let’s take a closer look at the many ways to make your report as unique as your data.
Report customization
The options within the Report Builder provide more than enough ways to make your report stand out as a one-of-a-kind, custom creation. Behind every option lies Jotform’s drag-and-drop functionality. As you add text, design, and data elements, simply click on the element to move it to the ideal location on the slide.
Basic Elements
To access the Basic Elements, click the Add Element button.
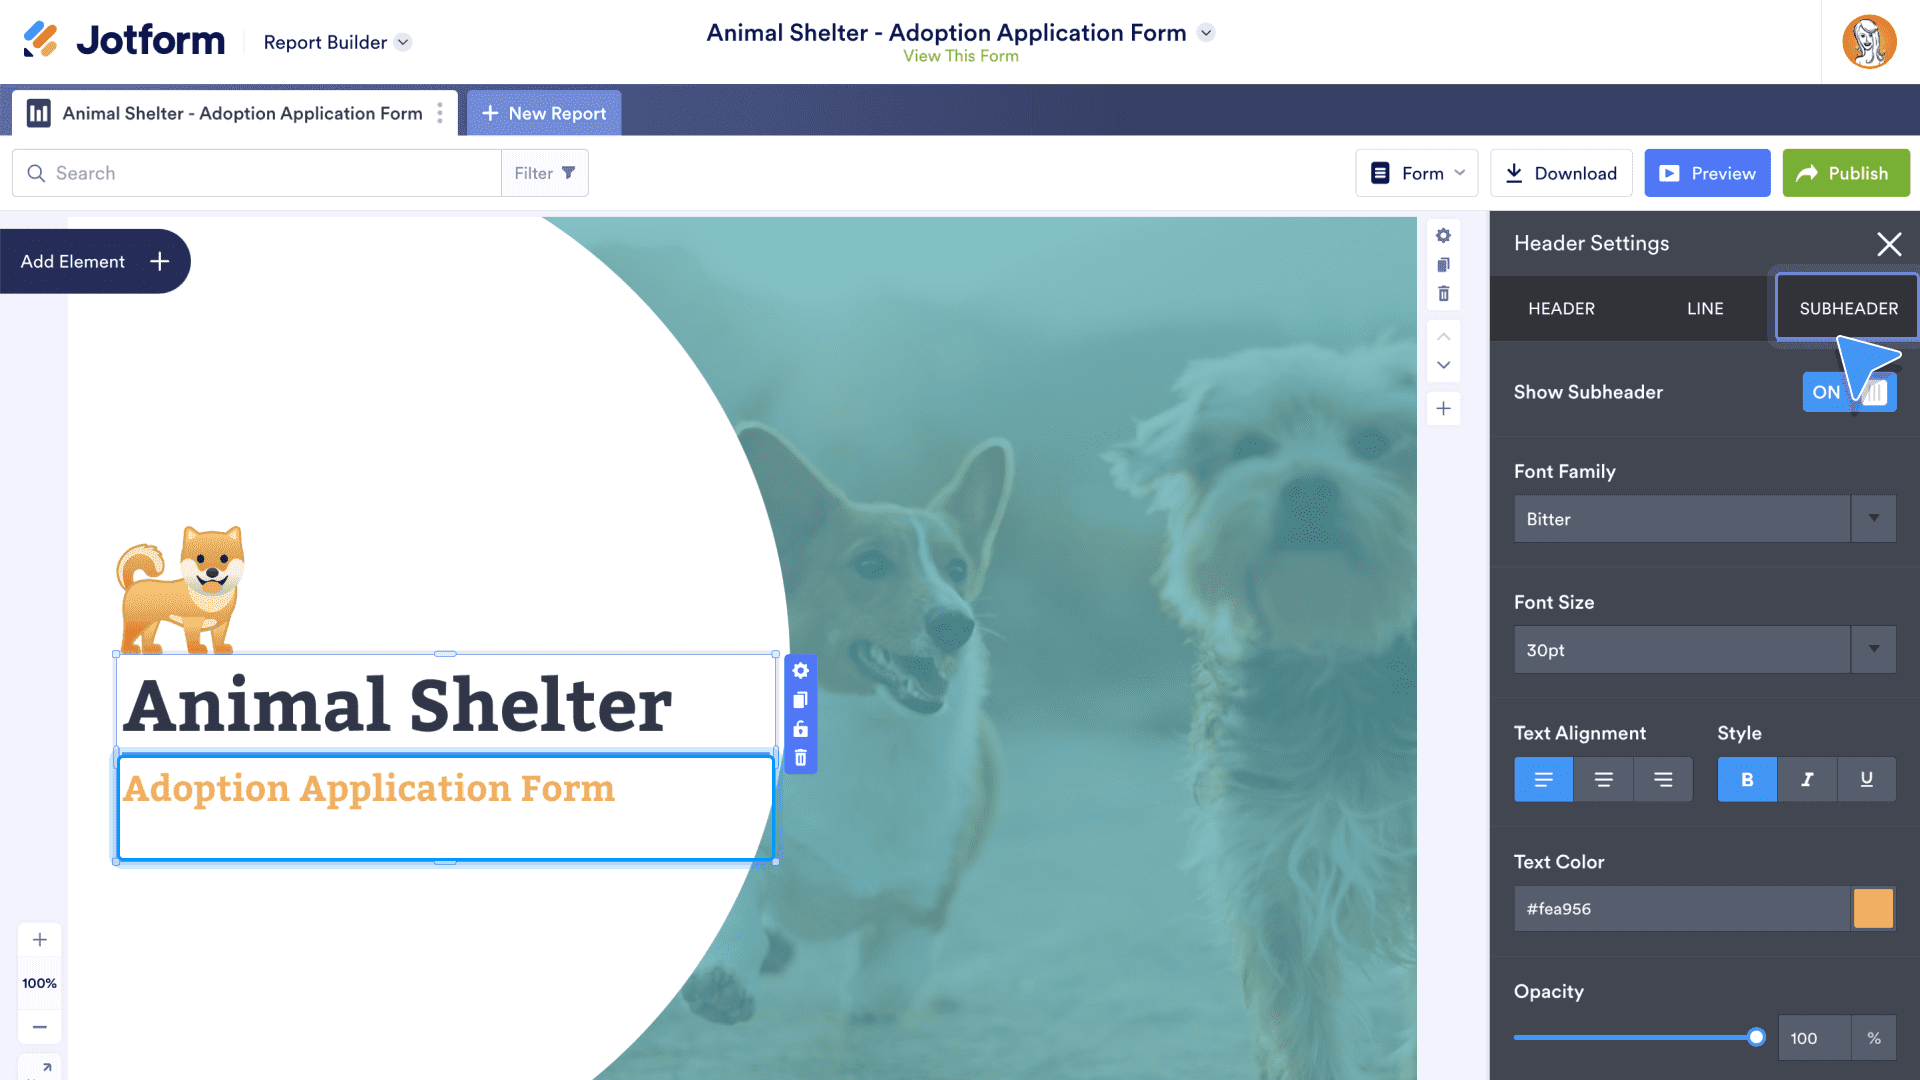
Each element has its own settings menu. To access it, click on the element and then on the gear icon to the right. In the Header Settings, use the Header tab to change the font, align text, and alter the opacity of the element.
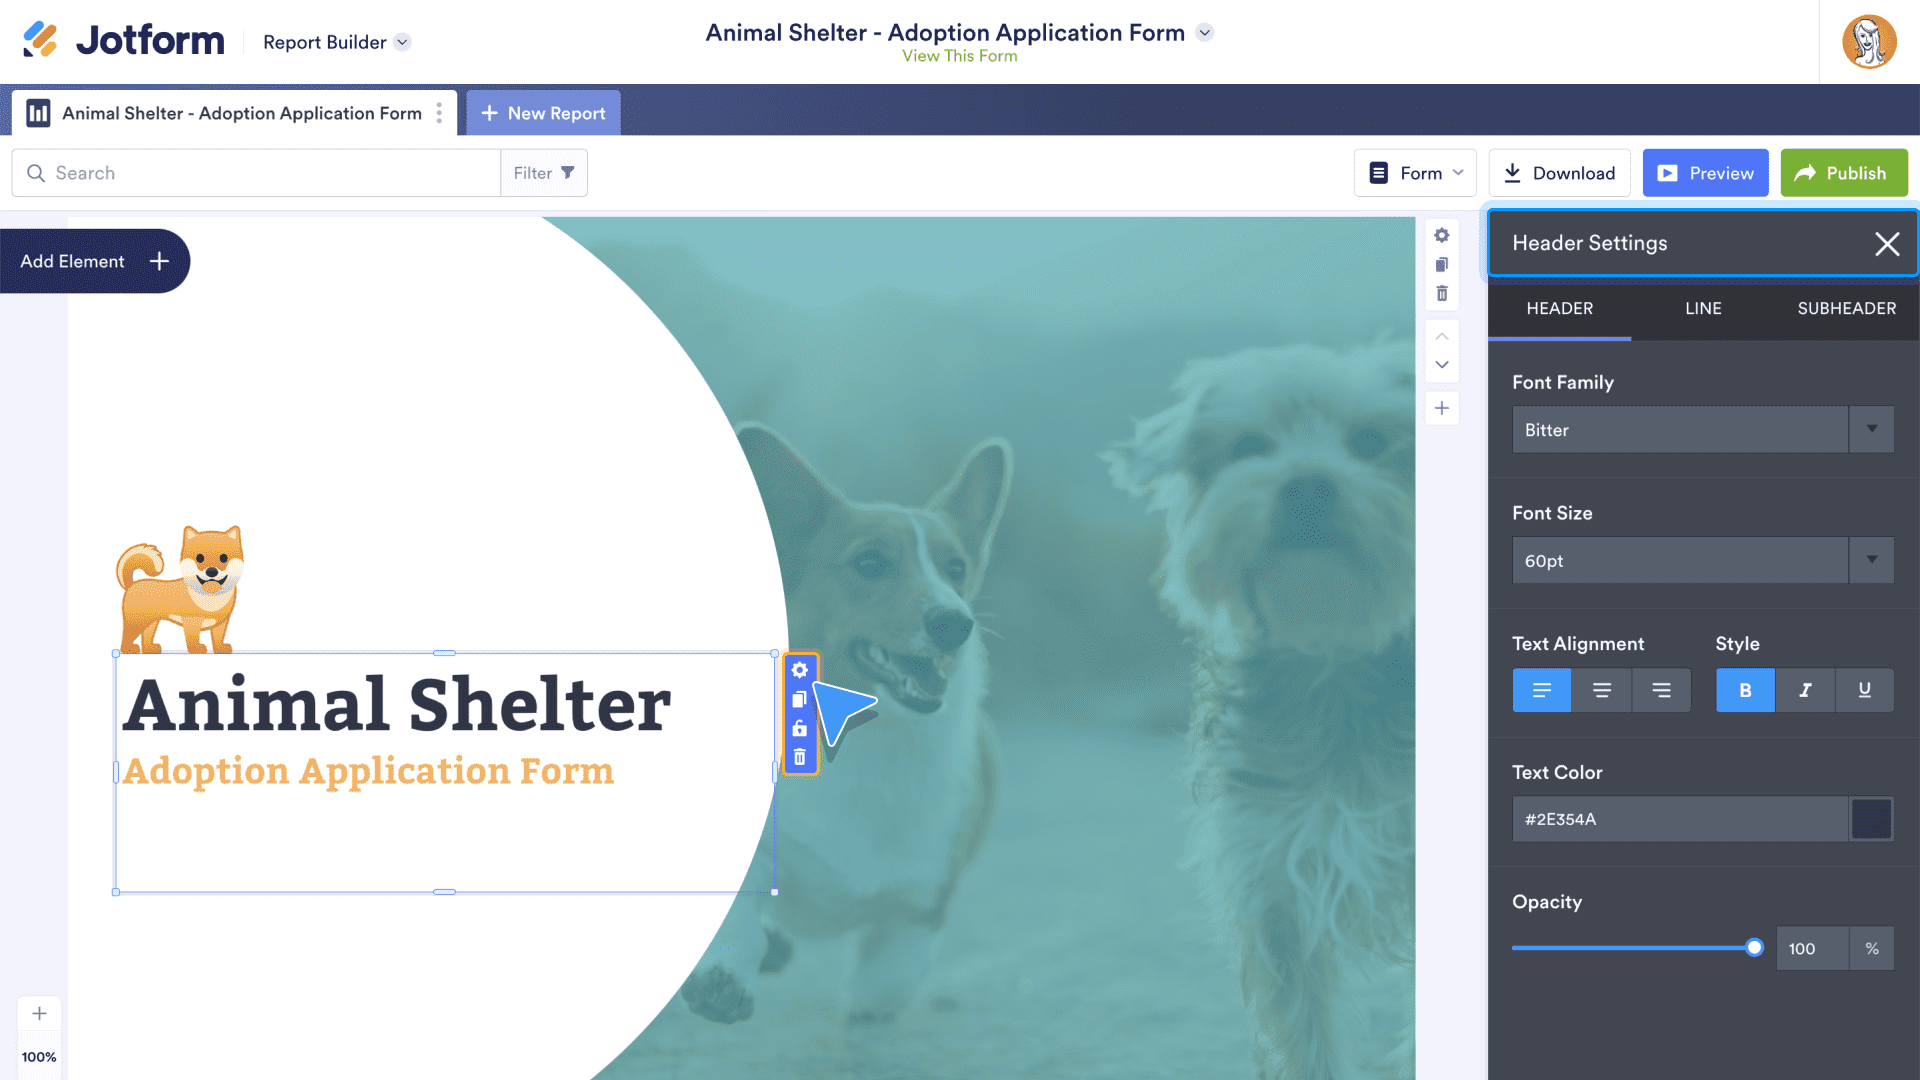
The Line tab of the Header Settings will add a line between header and subheader. The Subheader tab has the same customization options as the Header tab.
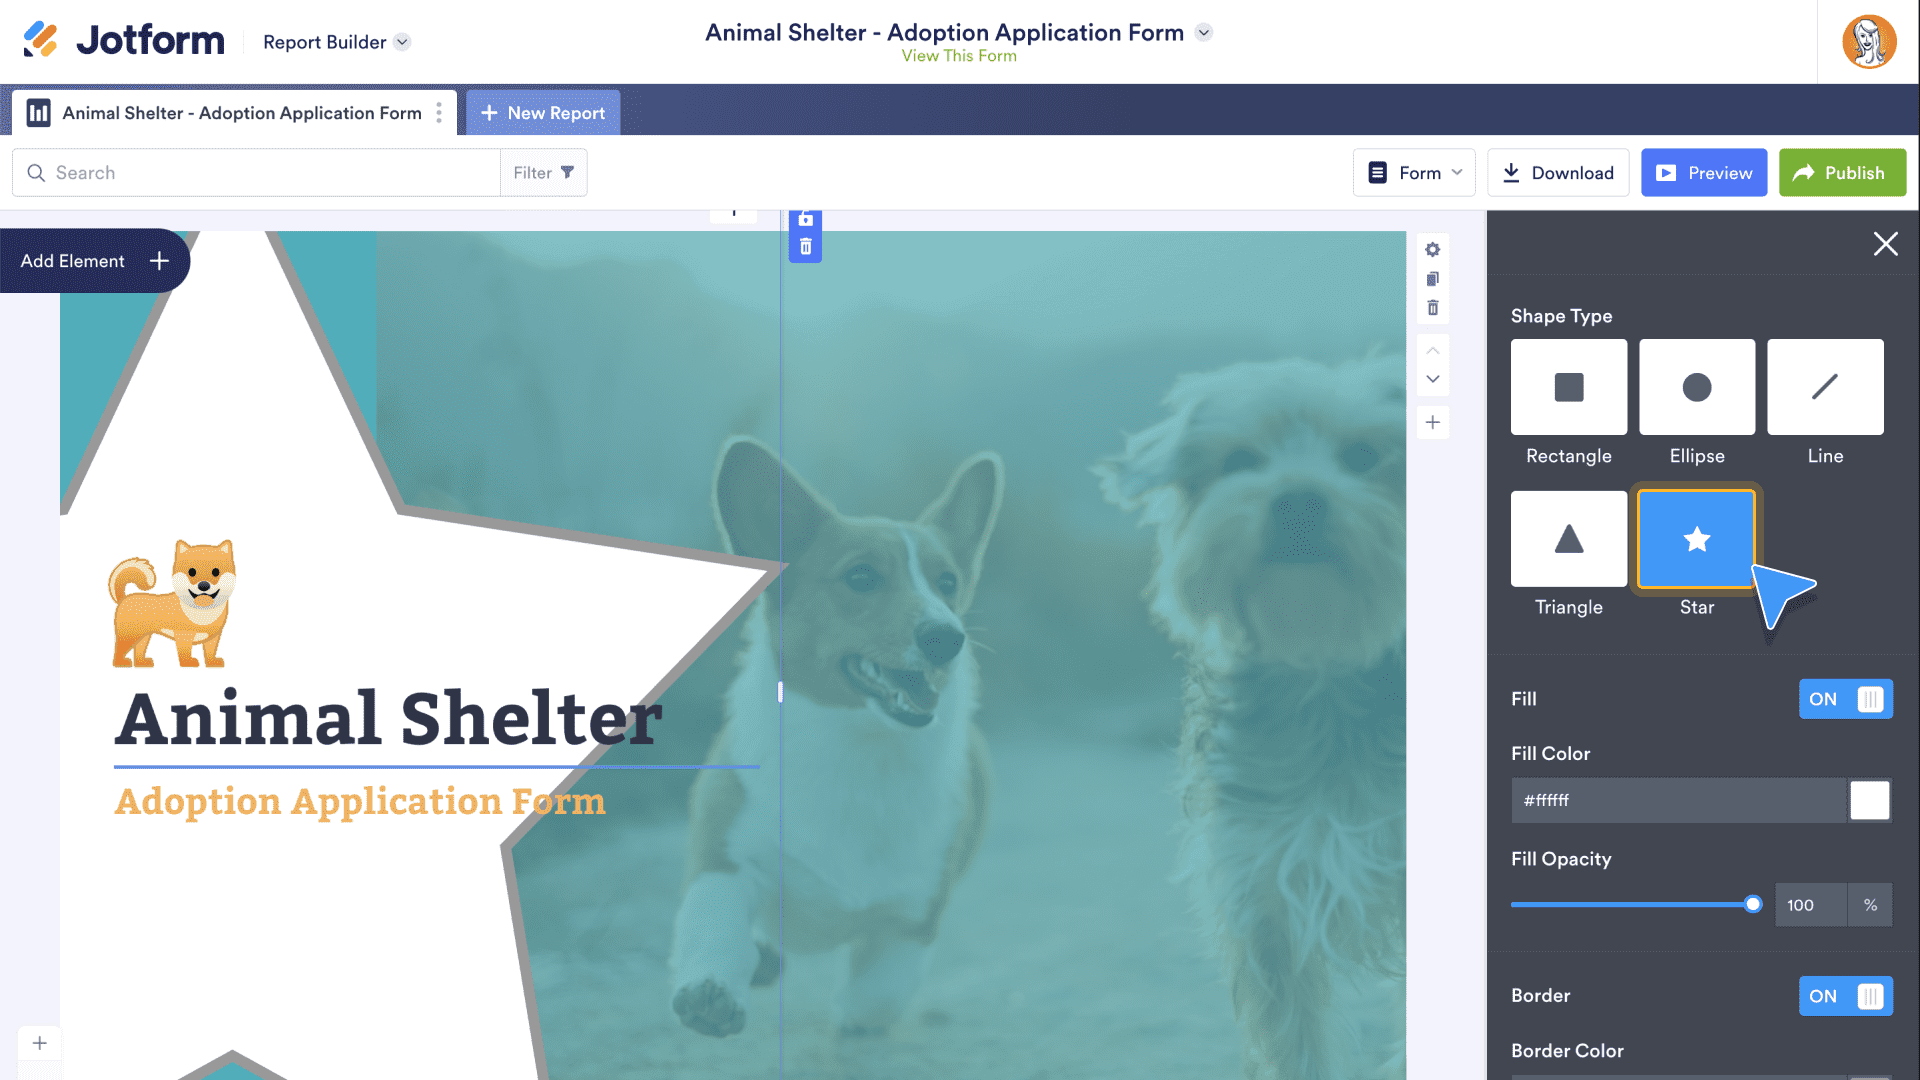
Use the Shapes element to quickly add a shape to any slide. Choose from Rectangle, Ellipse, Line, Triangle, and Star. You can customize the fill color and opacity or leave the shape unfilled, and adjust the border color surrounding the shape.
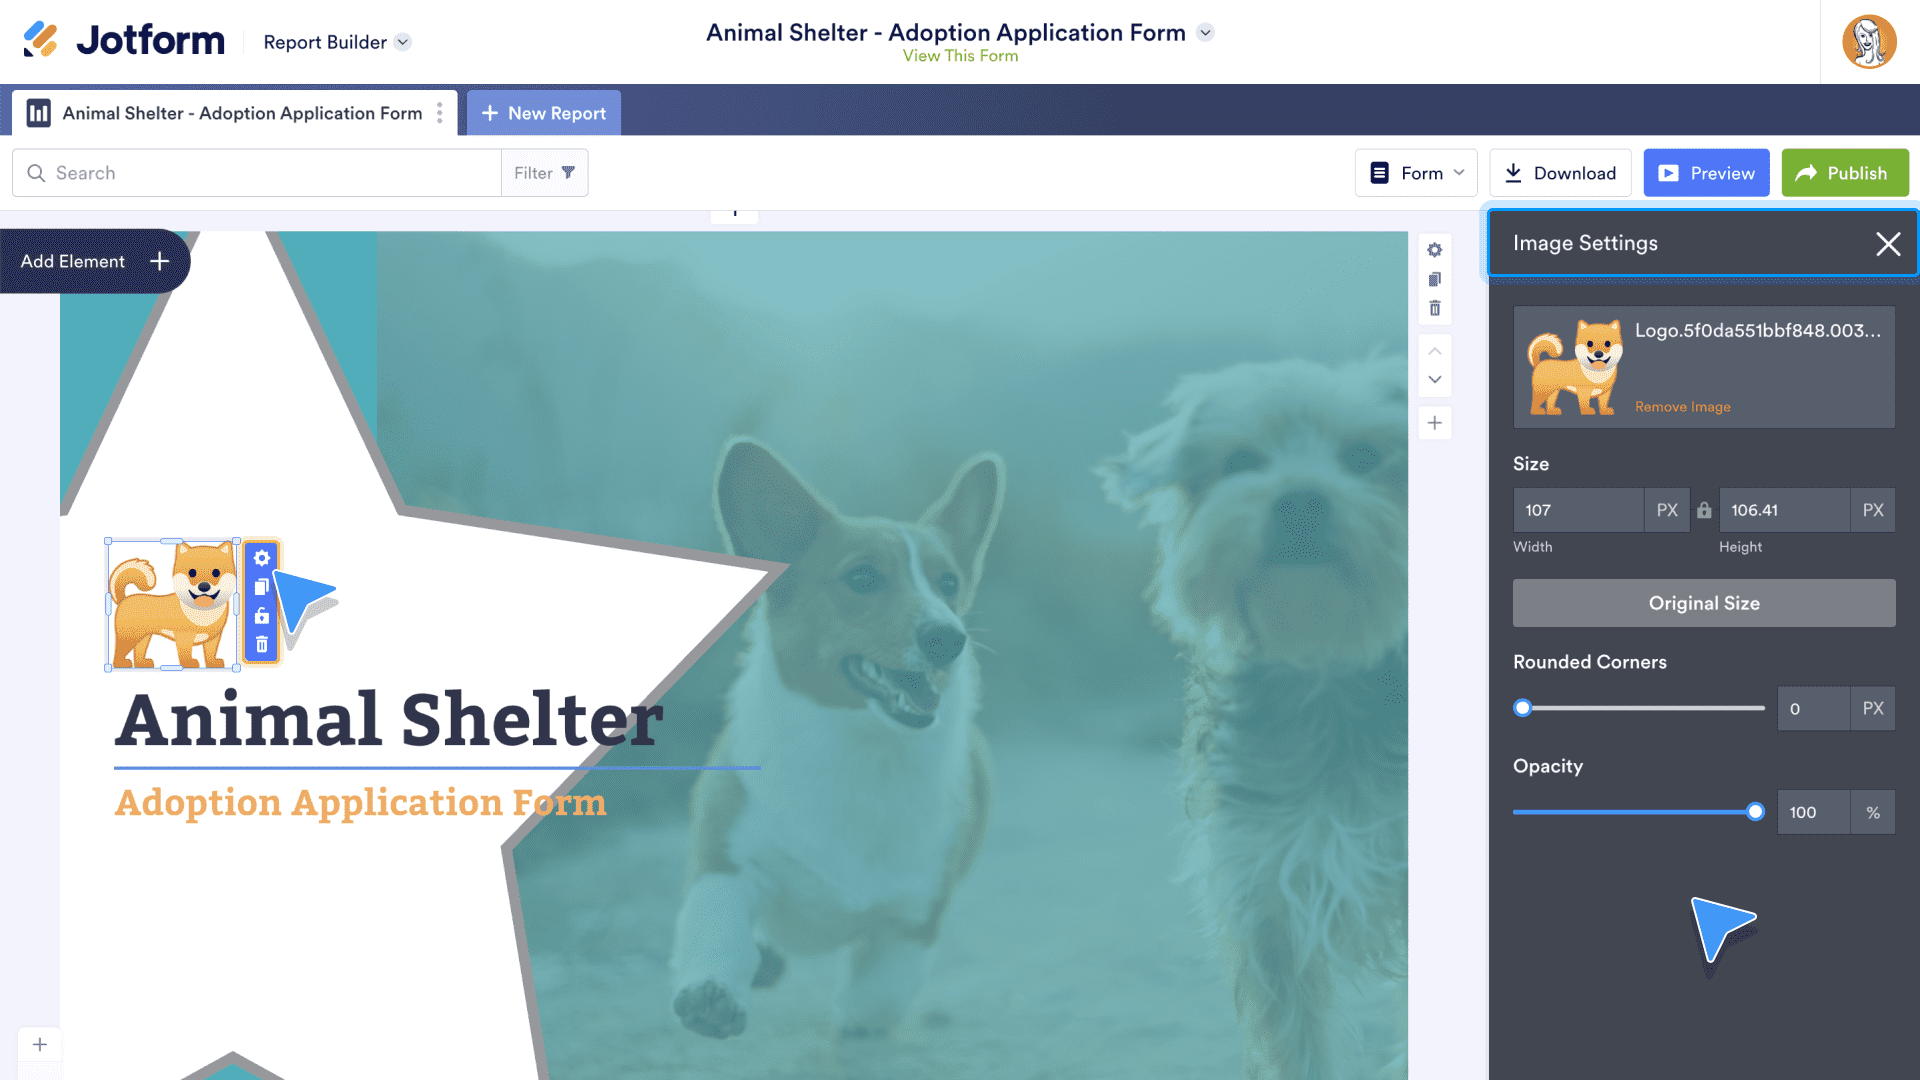
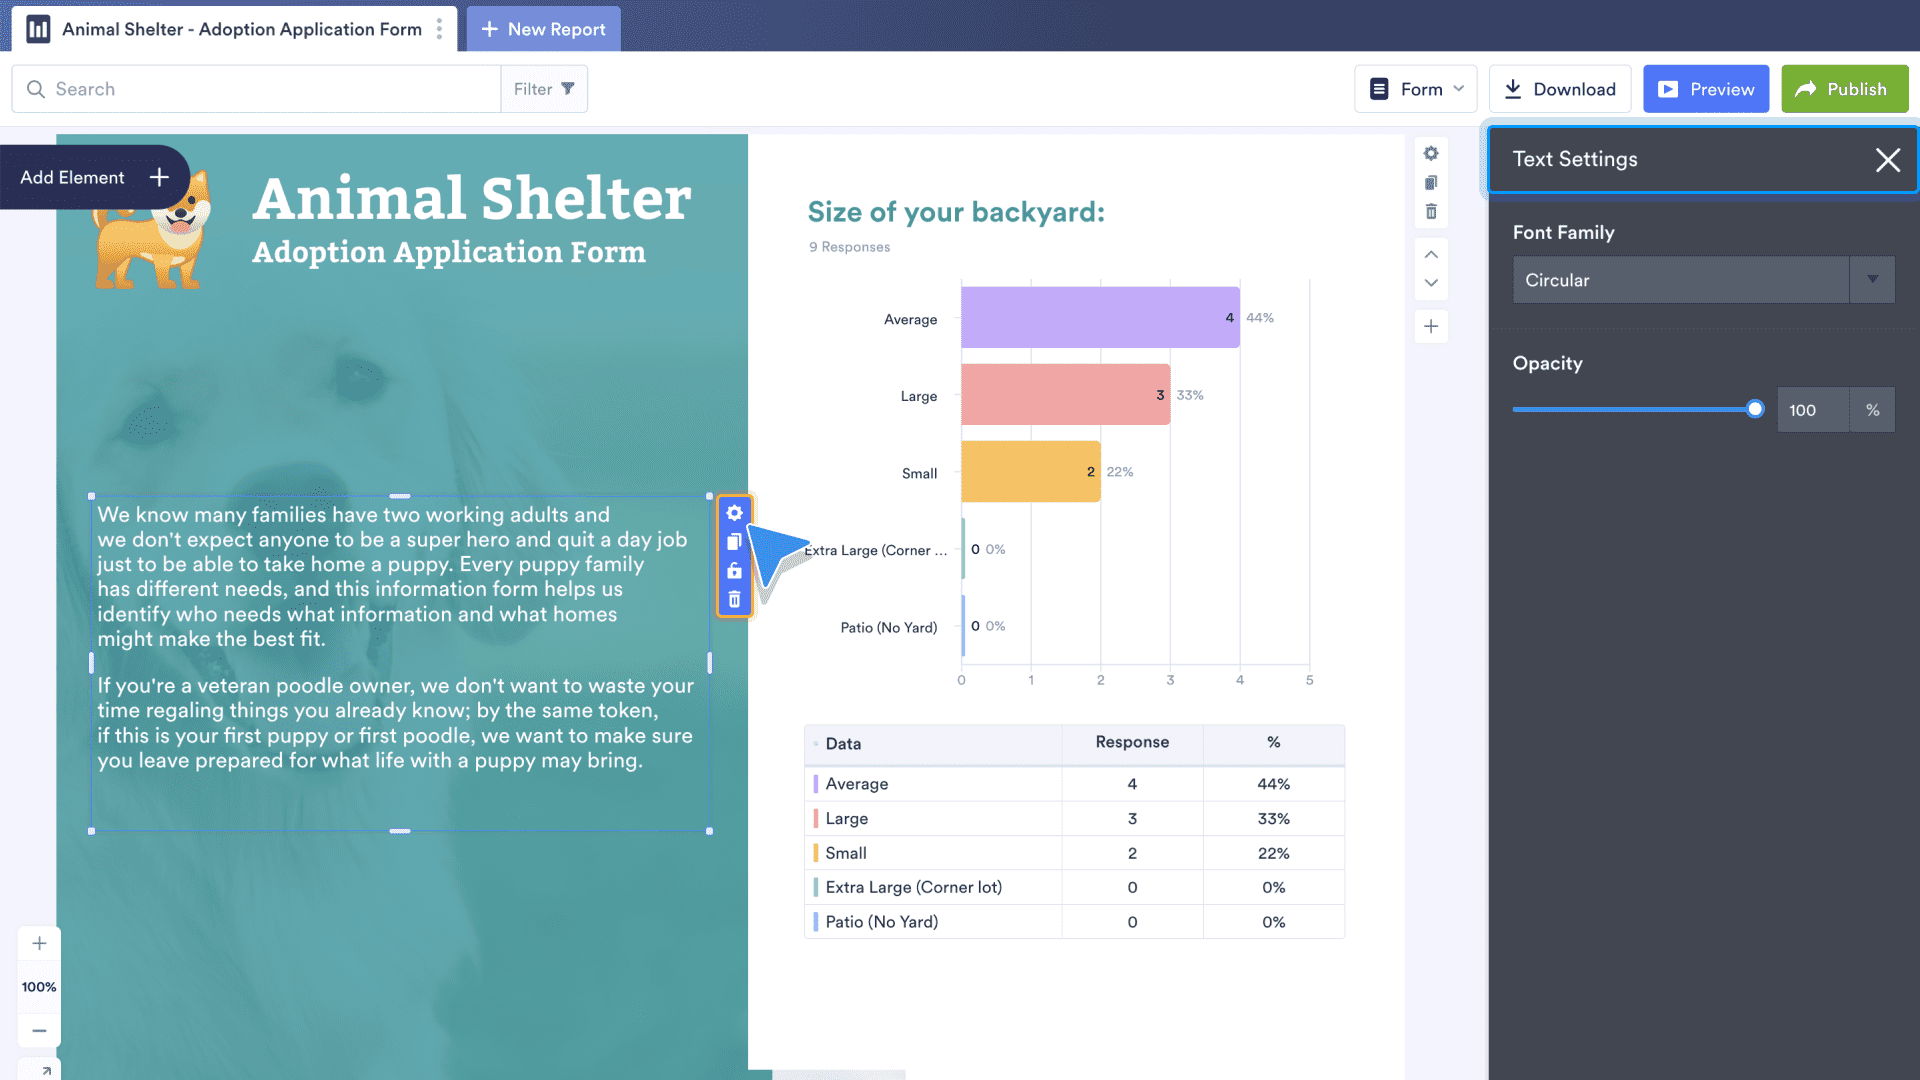
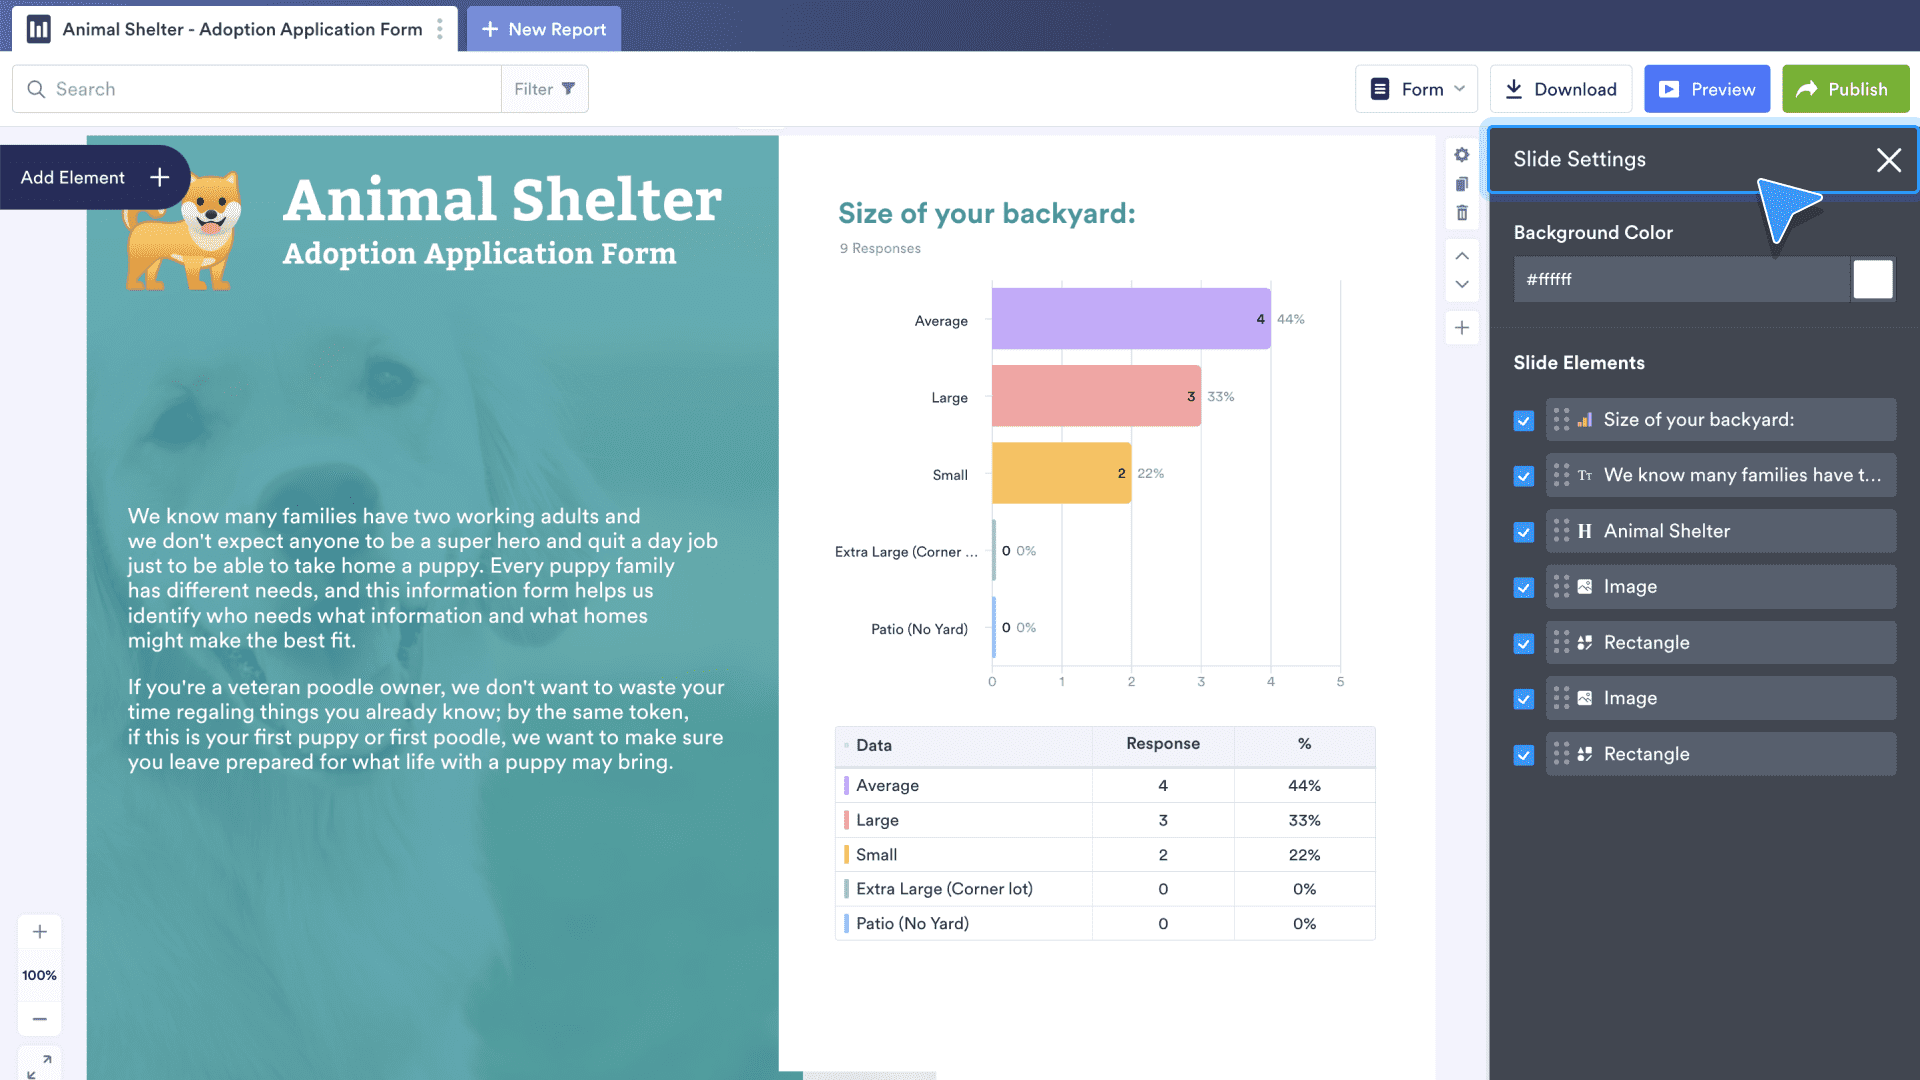
Click on any Image element to access the Image Settings. Use the settings to remove the image and add another one, change the size of the image, opt for rounded corners around the image, and alter its opacity. Note that in the slide following this paragraph, the large image of two dogs on the right is at 30 percent opacity. This allows the image to be present but not dominate the slide.
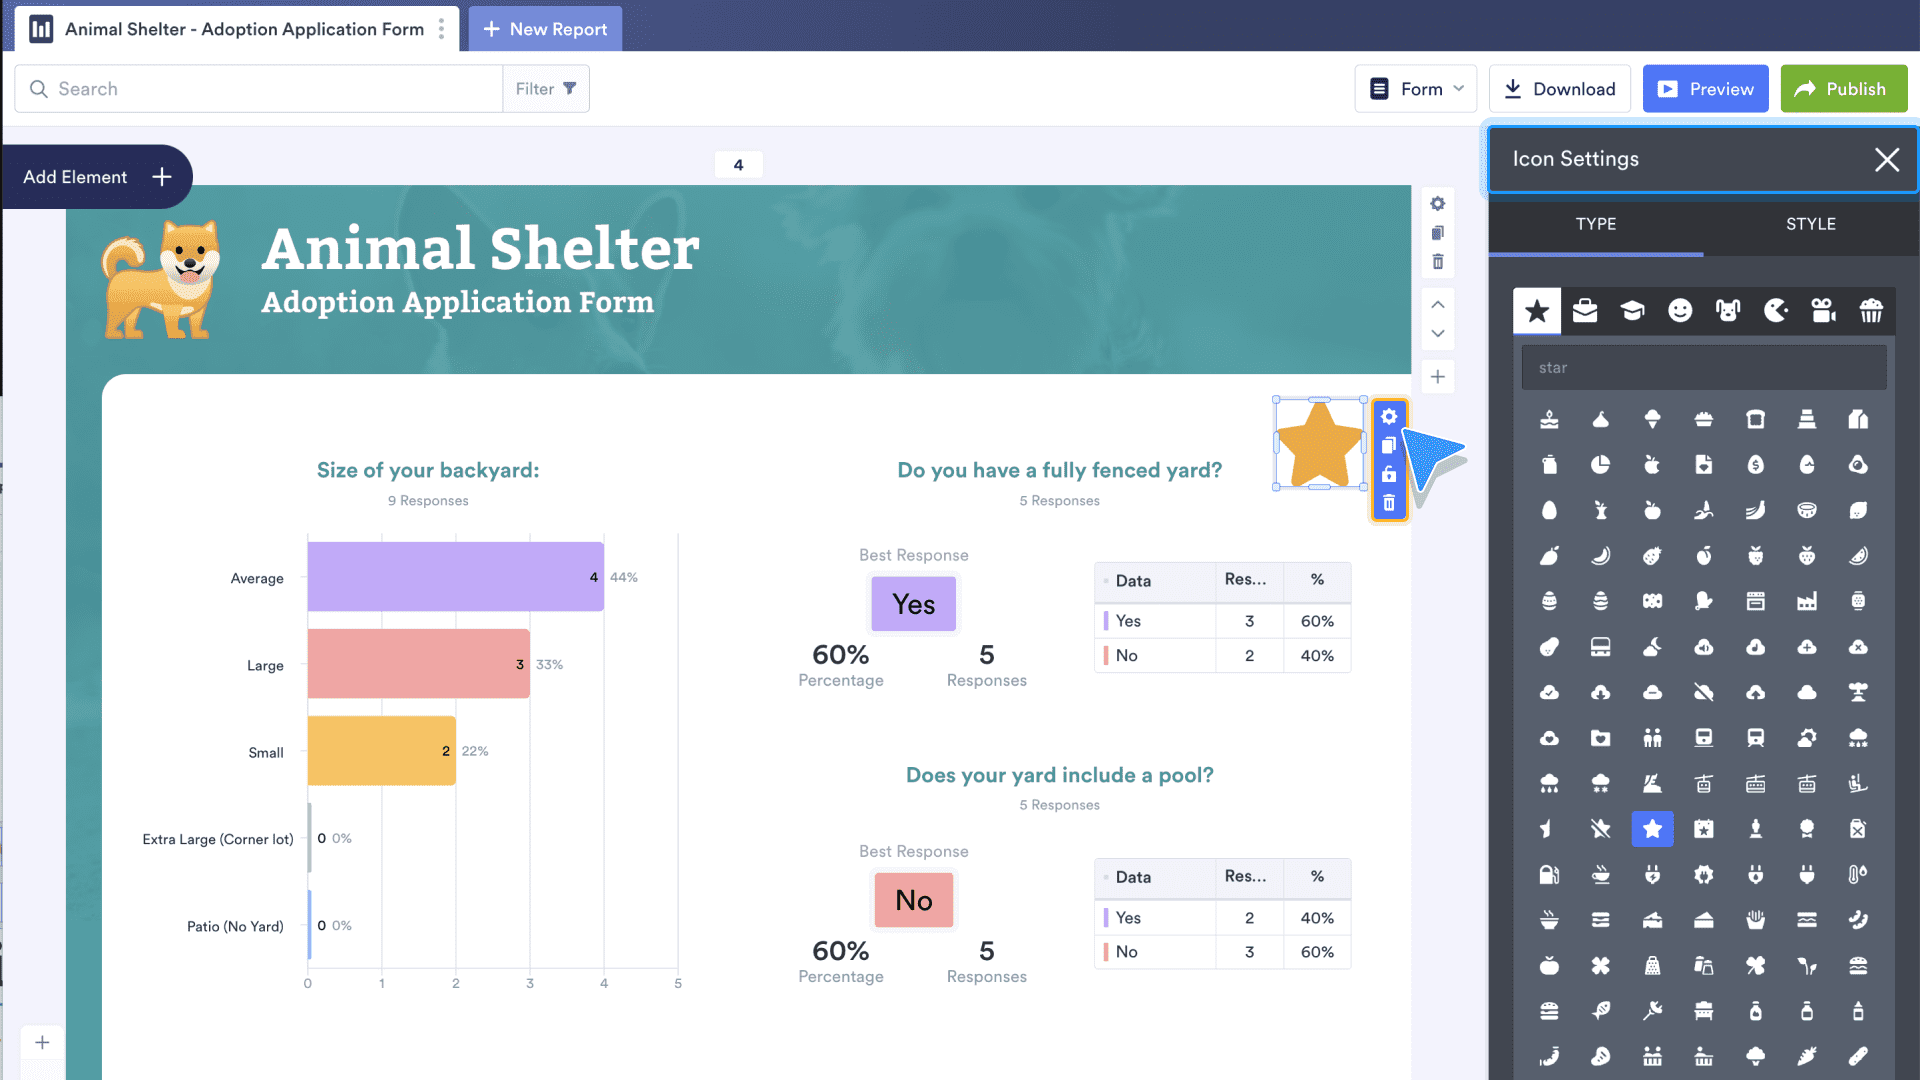
The Icon element provides access to hundreds of icons that add pizzazz to any report. Additionally, if you don’t have a logo, this element can provide a distinctive image that represents your brand or the theme of the report. Use the Style tab of the Icon Settings to change the color, opacity, and size of the icon after selecting an icon from the Type tab.
To add context to your data, add a Text element. Use the Text Settings to change the font and opacity of the text.
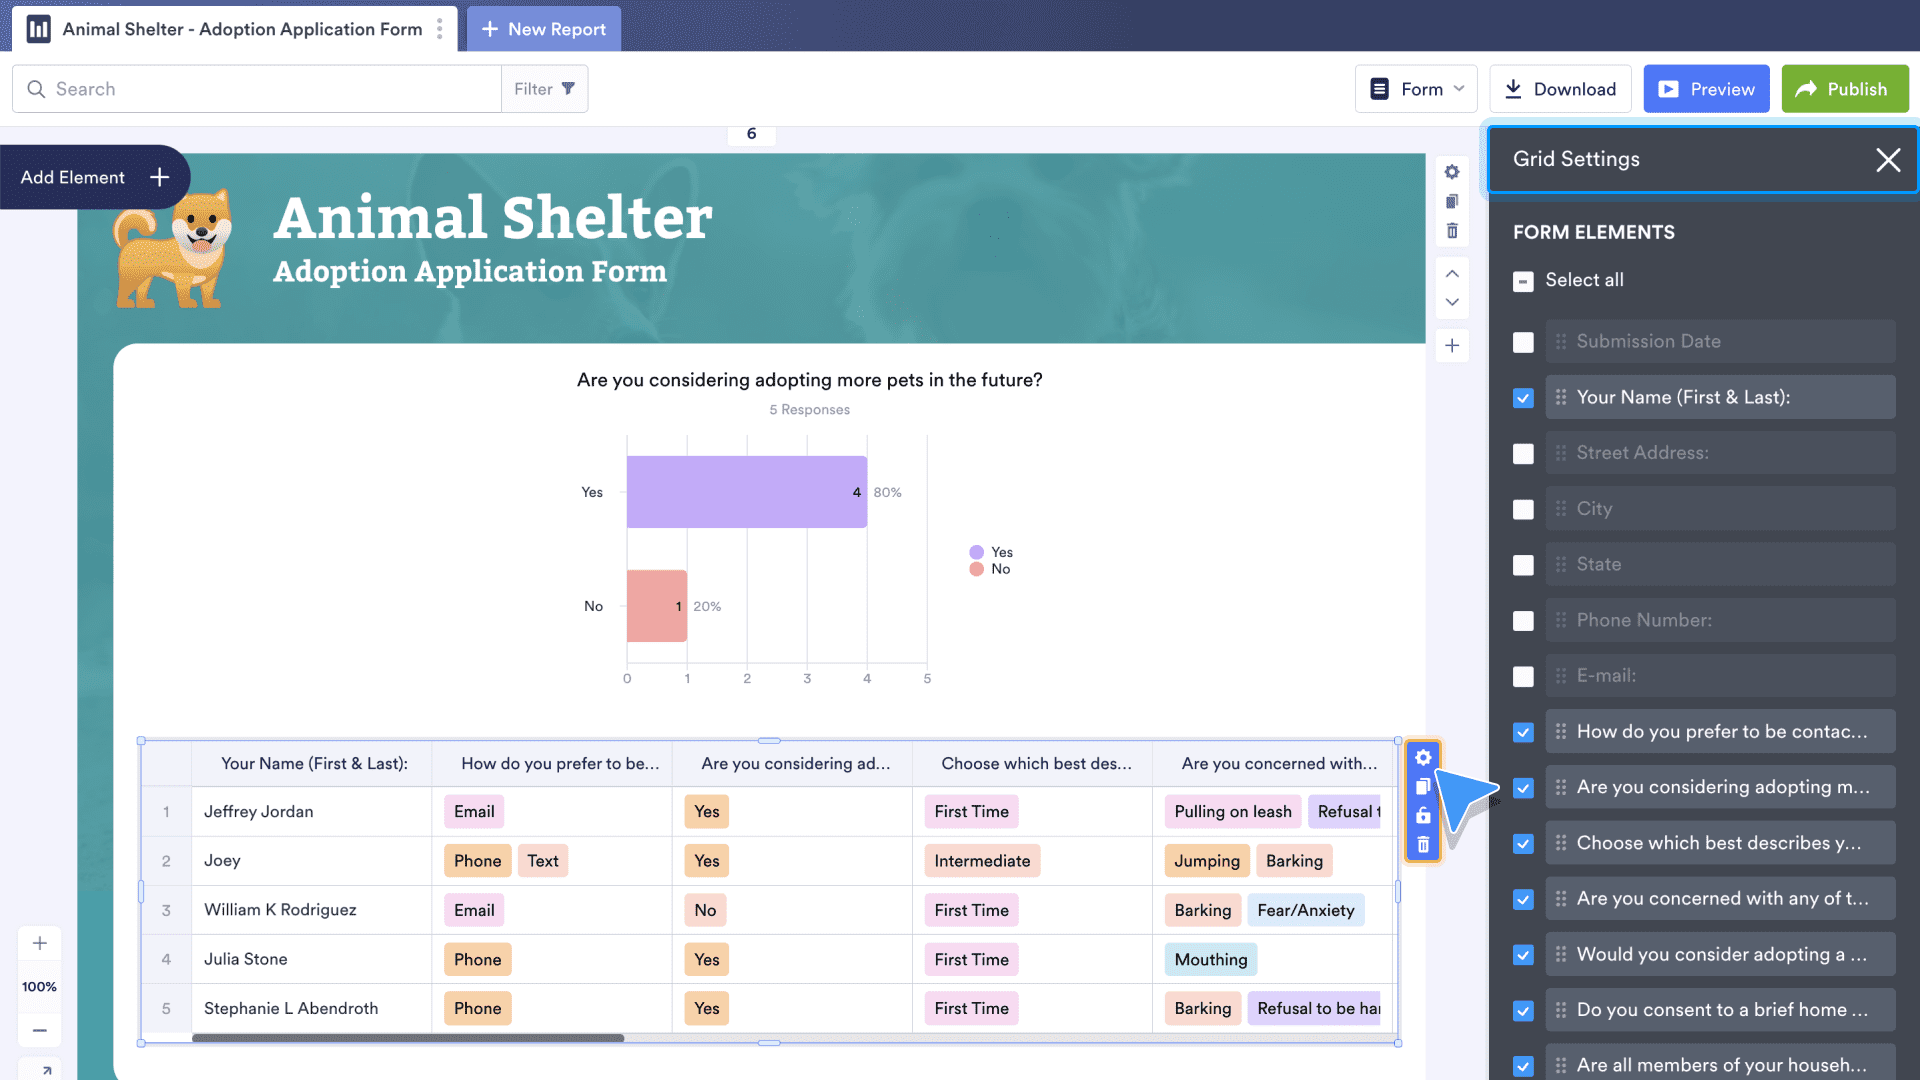
The Grid element displays a grid with all of your form submission data in one place. In the next slide, a grid has been added to a slide along with a submission data chart. The Grid Settings menu displays all of the elements on the form. Use the checkboxes to the left of each field name to indicate which data to display in the grid.
Form Fields/Chart Settings
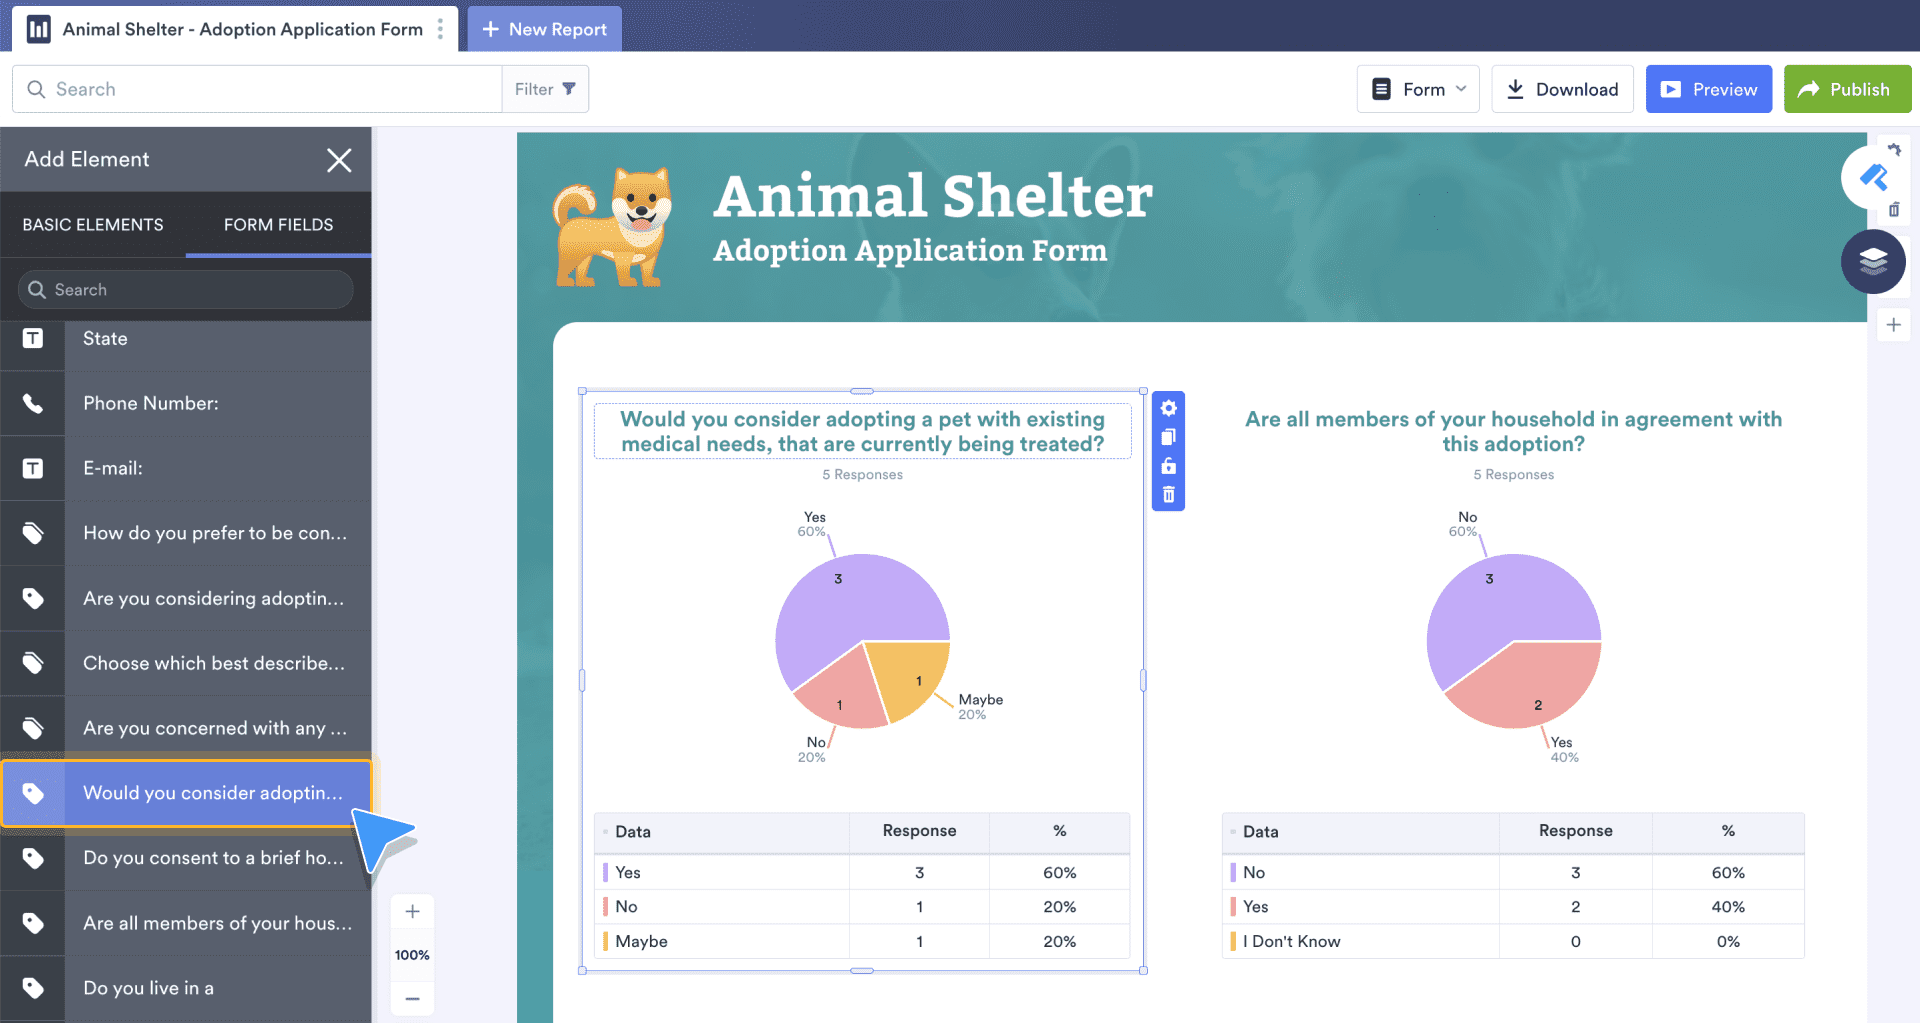
Go to the Form Fields section of the Add Element menu to view all form elements in one place. In the Report Builder, each form element will become a chart that displays submission data. Click the Form Field element to add it to a slide or drag and drop it into the desired location. Once added, open the Form Field’s Chart Settings using the gear icon.
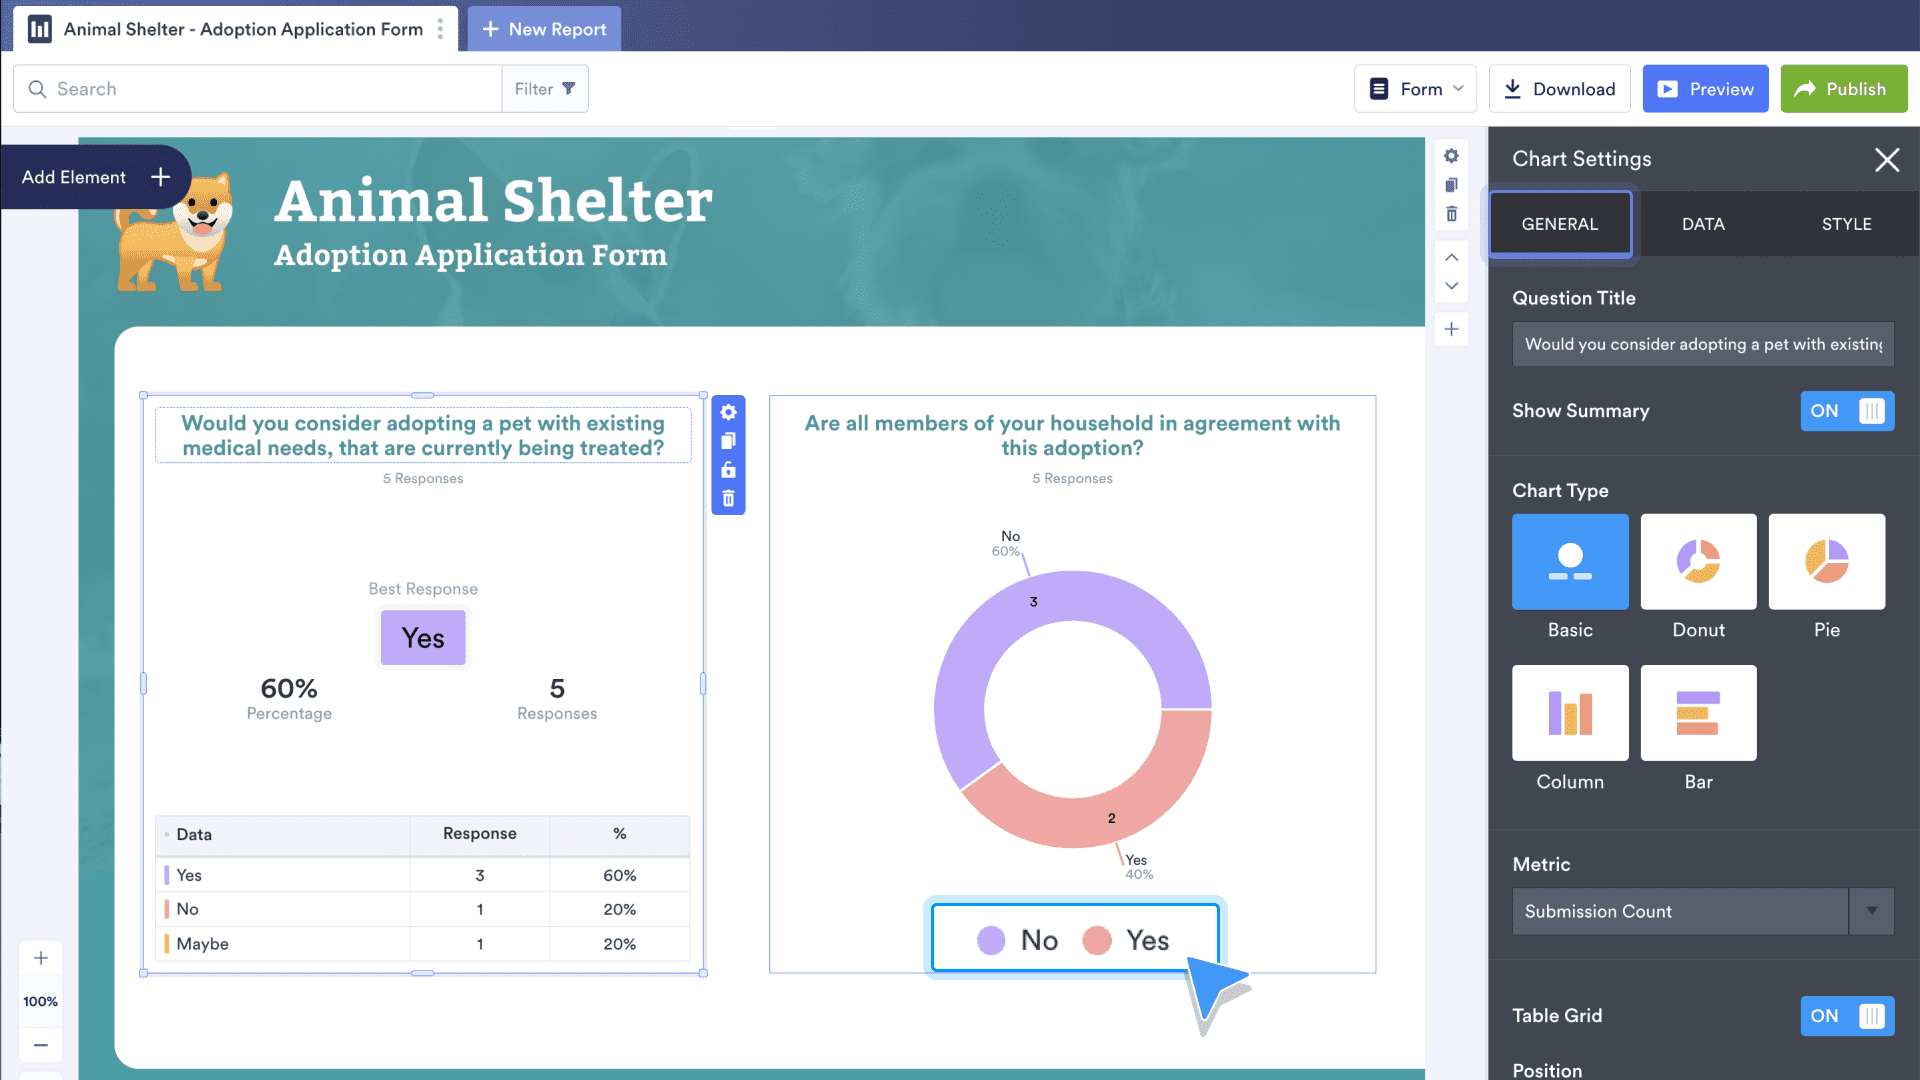
Within the General tab of the Chart Settings, change the title question, which appears at the top of the chart. You can also show a summary that displays the number of responses to the question, change the chart type, change the metric of the chart, remove the table grid that appears below the chart, and alter the position of the chart on the slide. For chart types other than basic, choose whether to add a legend rather than a table grid.
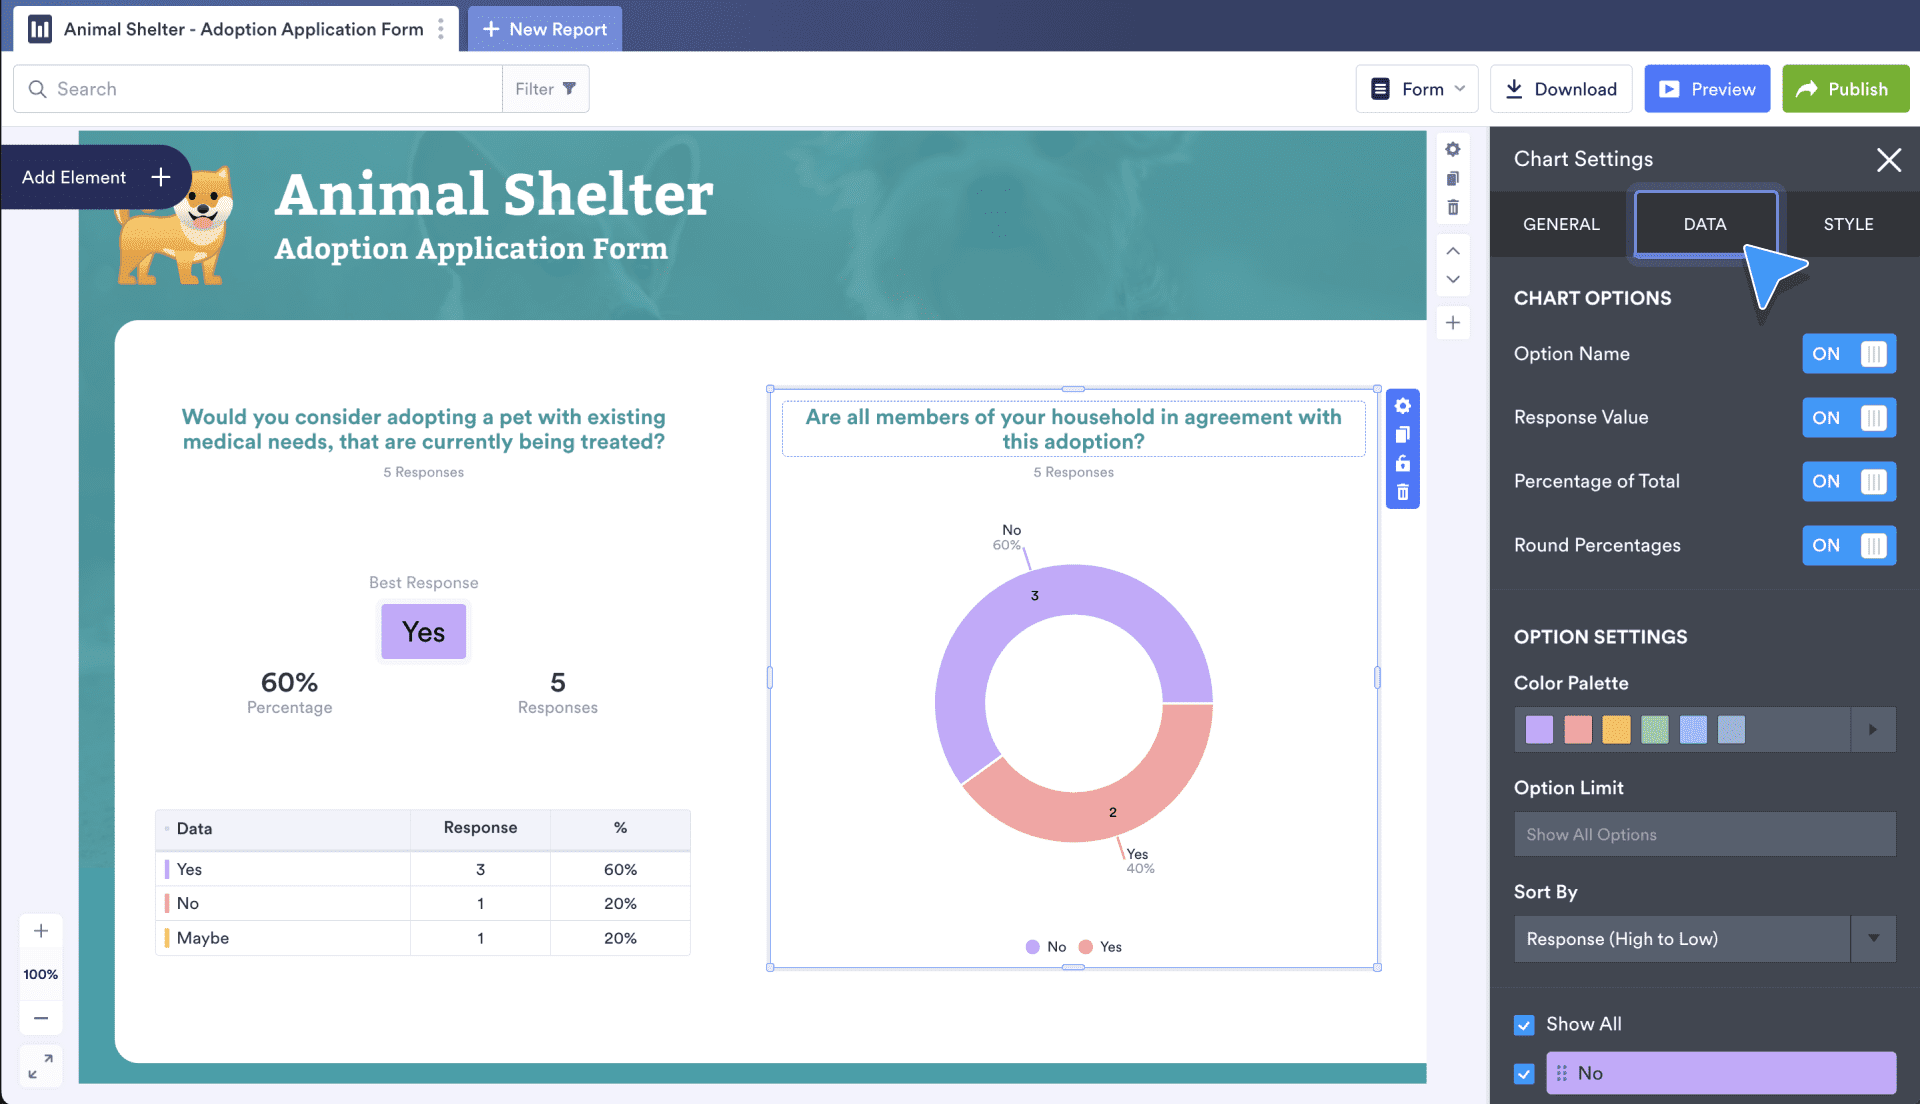
In the Data tab of the Chart Settings, you can display the Option Name (the “Yes” and “No” labels on the donut chart below), the Response Value (the numbers displayed within the donut chart), the Percentage of Total (displayed under the “Yes” and “No” labels), and choose whether or not to round percentages.
Additionally, you’re able to choose a Color Palette for the chart, display some or all of the responses, and sort responses numerically, alphabetically, or using a custom sorting method. Use the Option Limit field to cap the number of options that can be shown on the chart.
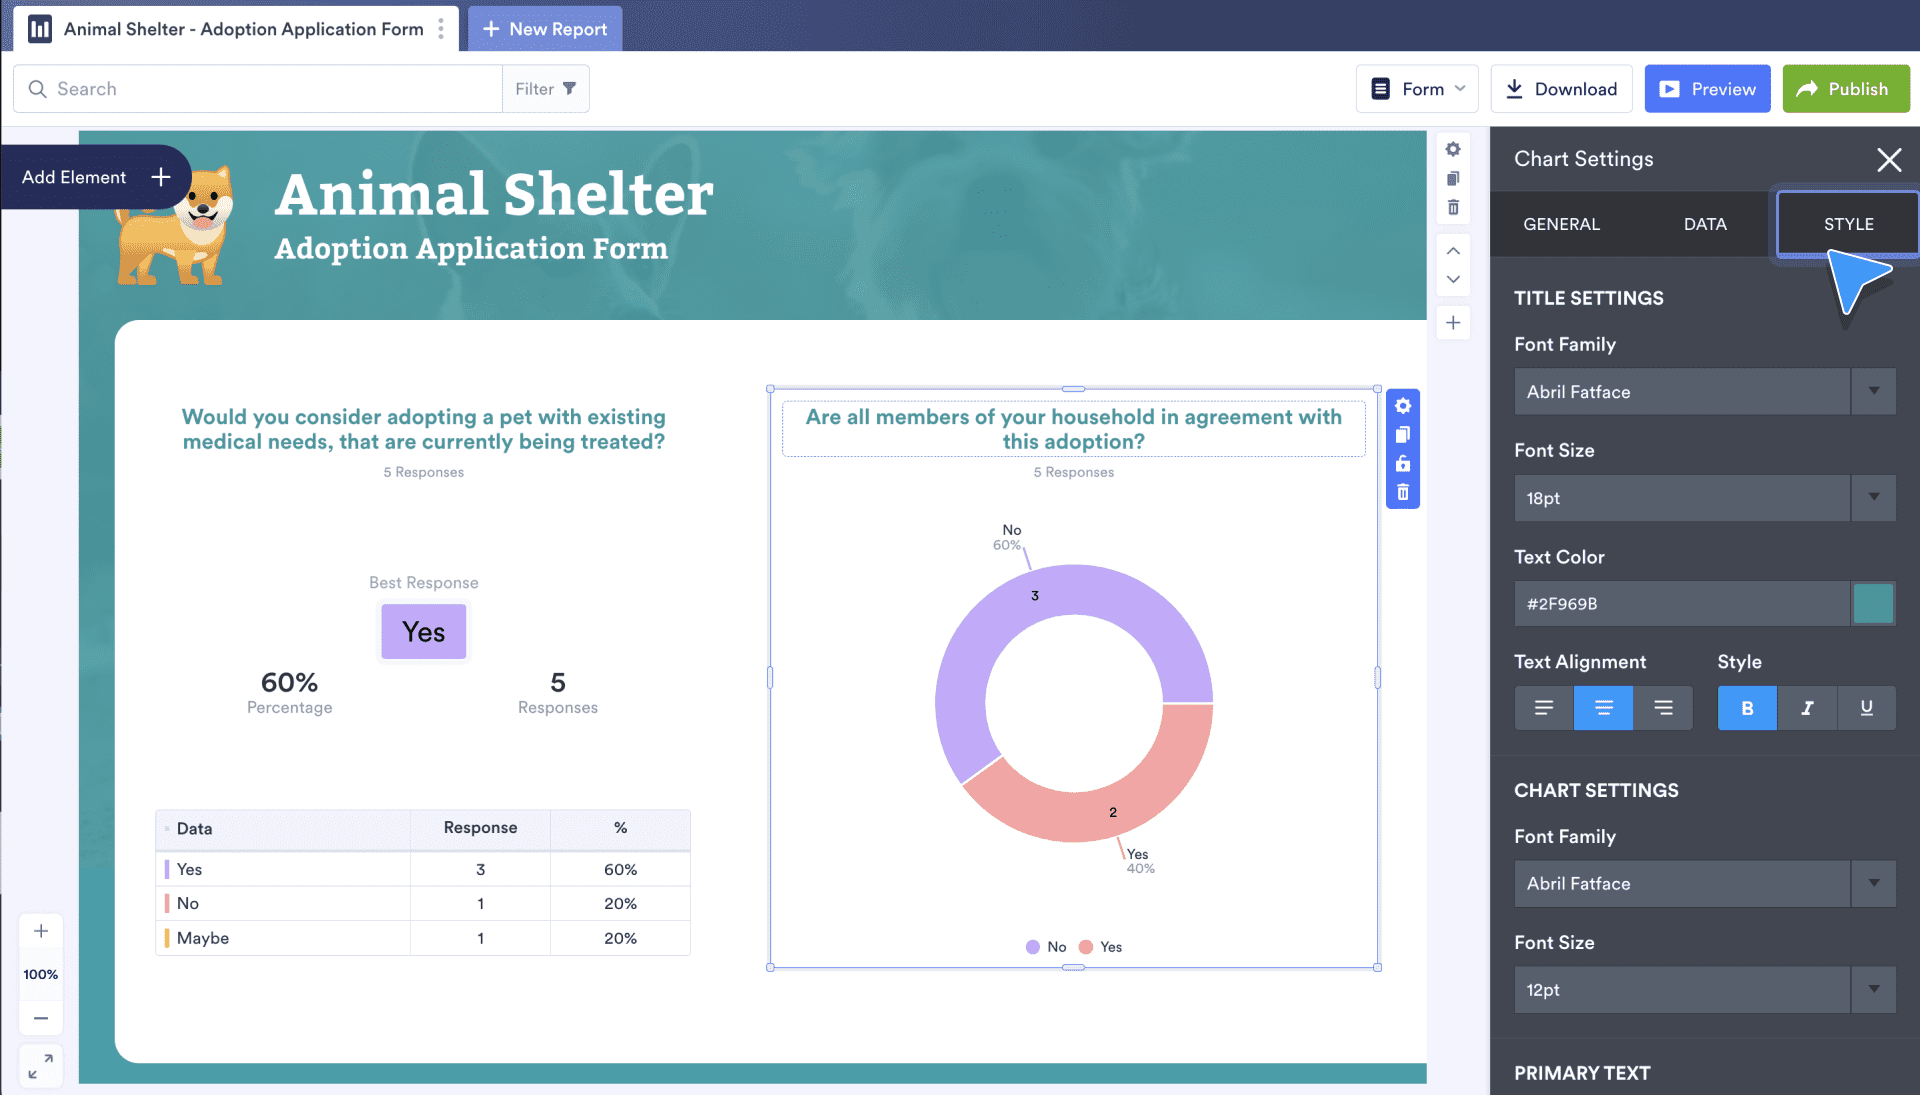
Go to the Style tab of the Chart Settings to alter the font of the chart title and the chart itself, including a different text color, text alignment, and text treatments like bold, italic, and underline.
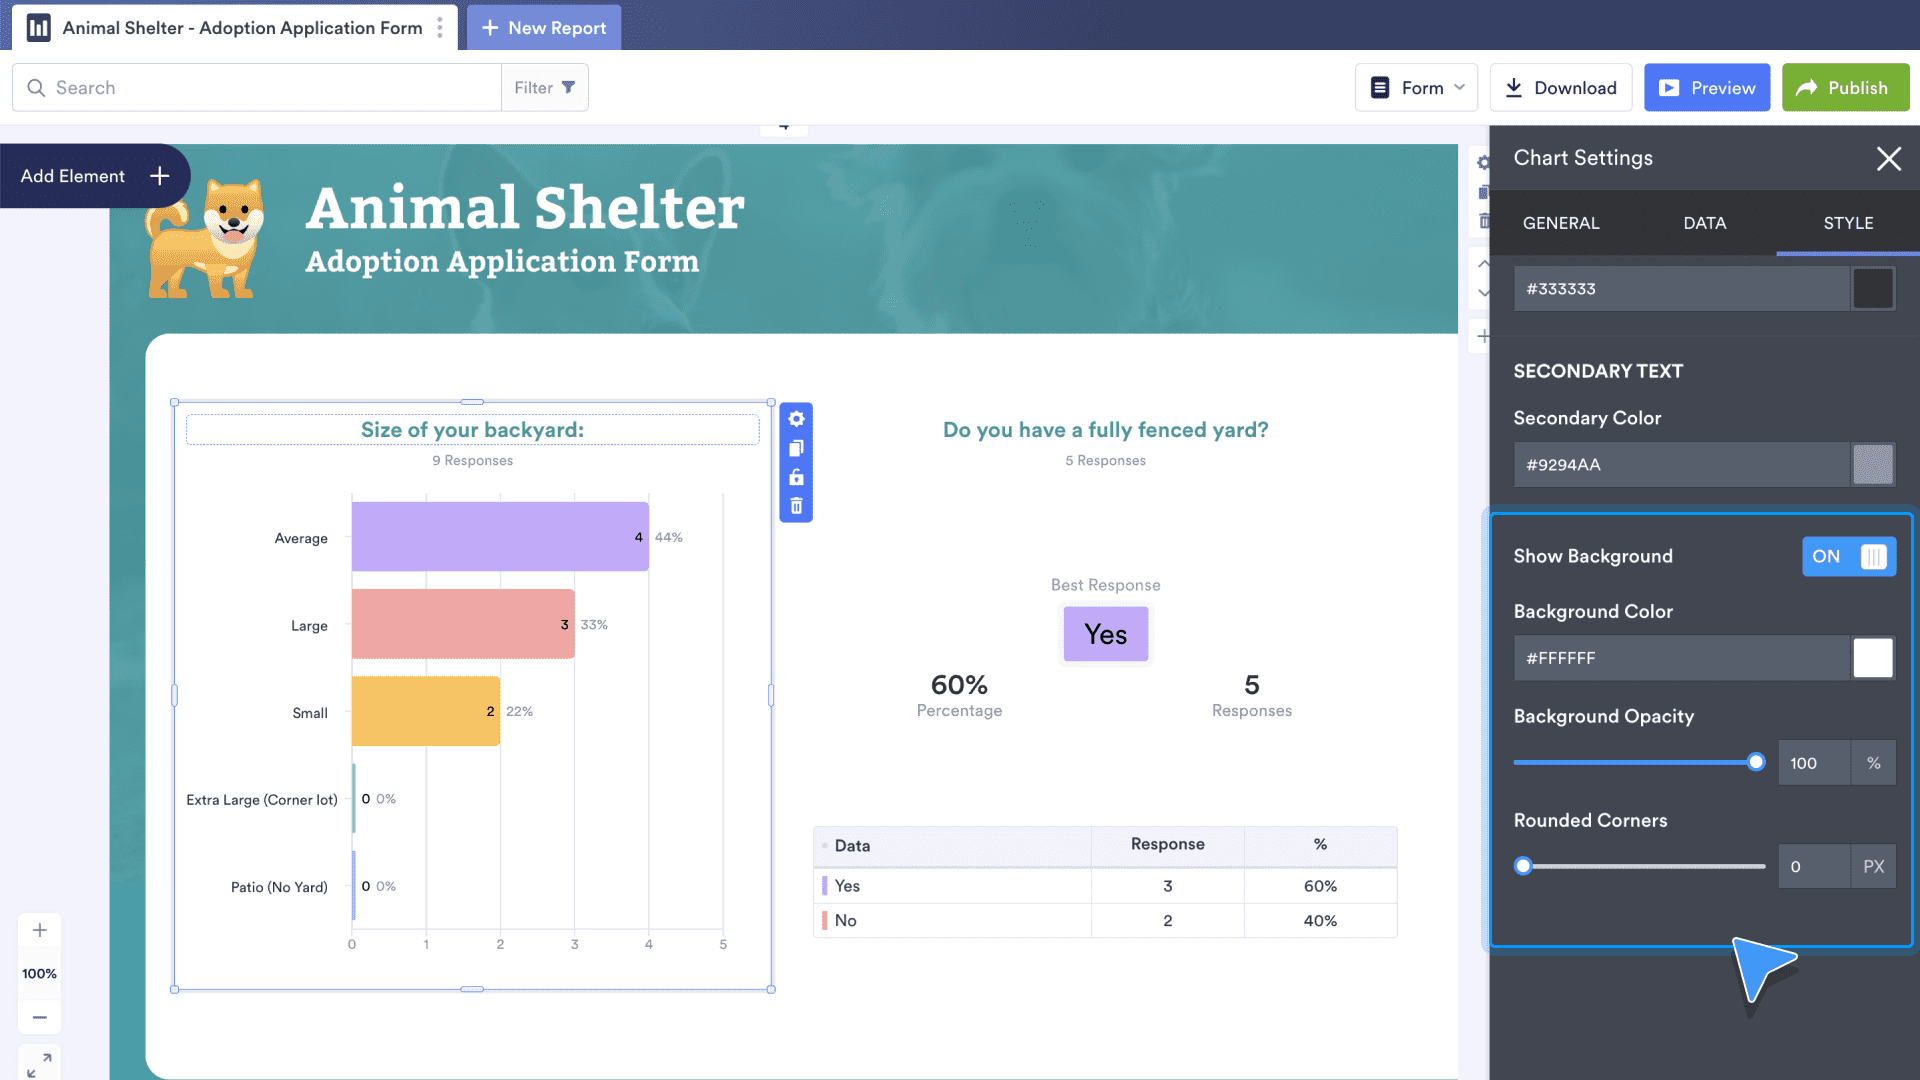
At the bottom of the menu are options to stylize the background of the chart. You can turn the Show Background option on or off. It’s also possible to change the color of the background, its opacity, and corner shapes.
Upload CSV or Excel data to Jotform Report Builder
To create a report with imported data rather than submission data, go to the My Reports page and click Create Report.
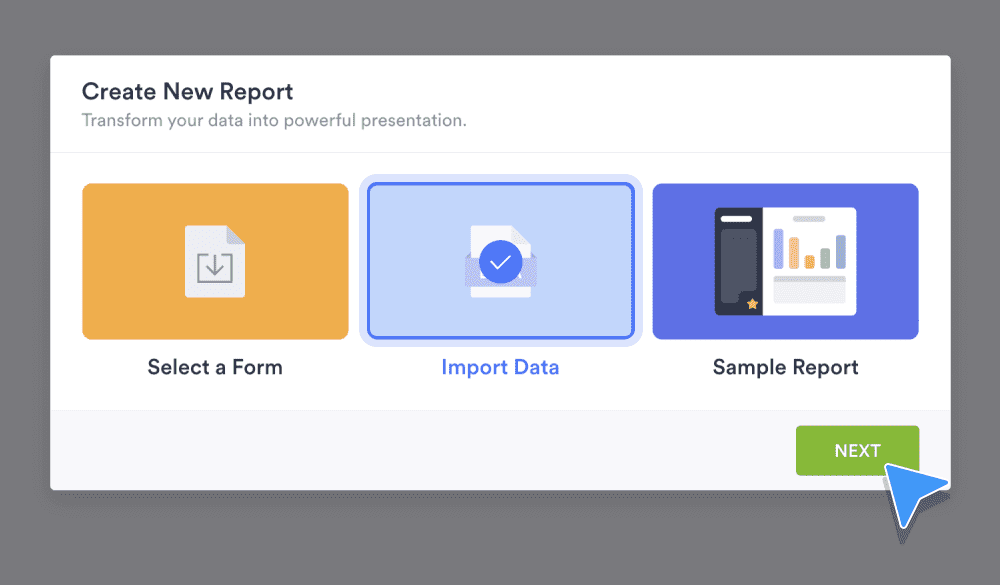
Select the type of report you’d like to create. On the following screen, select Import Data and then click Next.
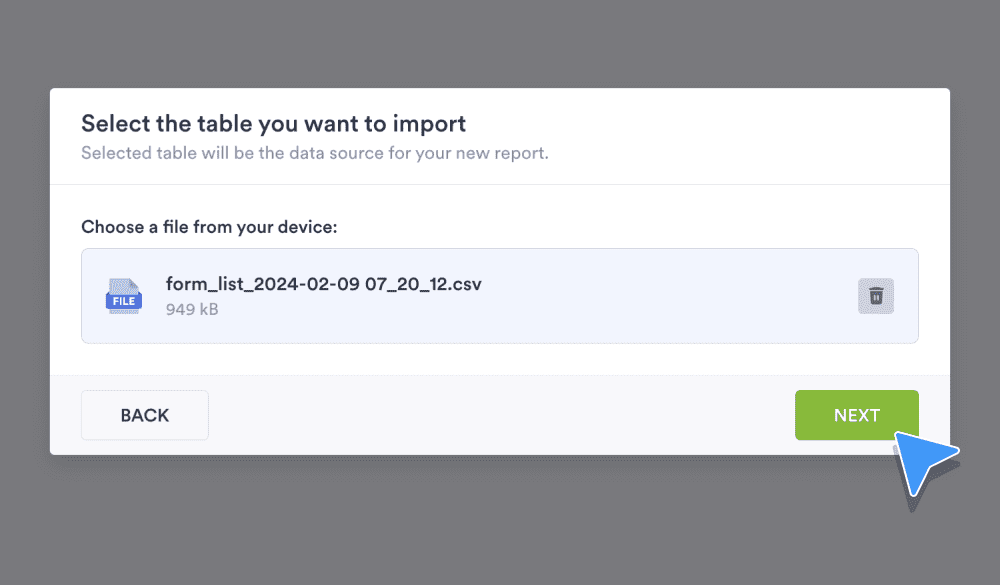
On the next screen, upload your data and click Next to proceed.
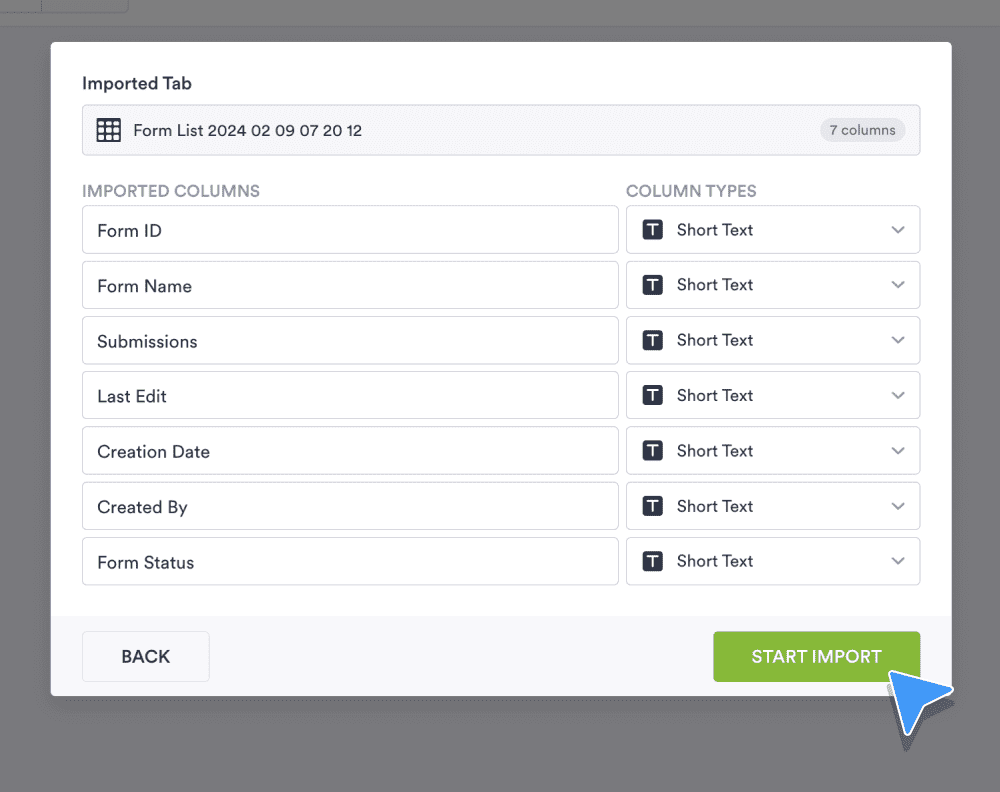
Match the imported data columns with Jotform column types and click Start Import.
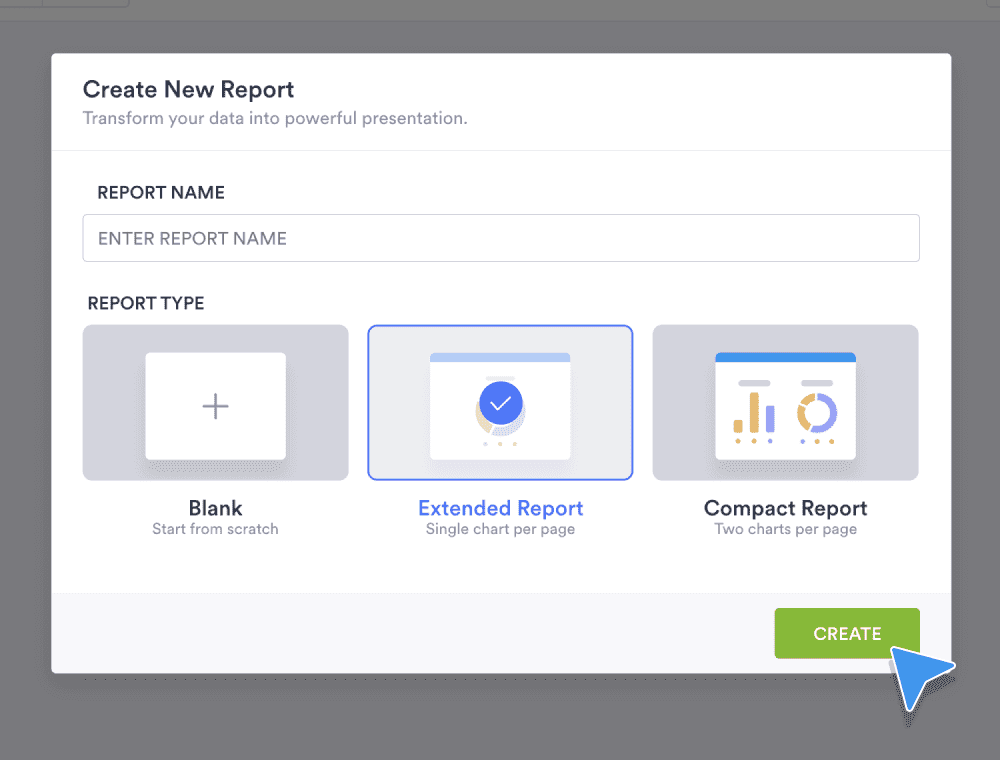
Finally, use the options on the following screen to name the report. You can create a blank report, an extended report, or a compact report. Use the Create button to finish creating the report.
Slide and Layout Settings
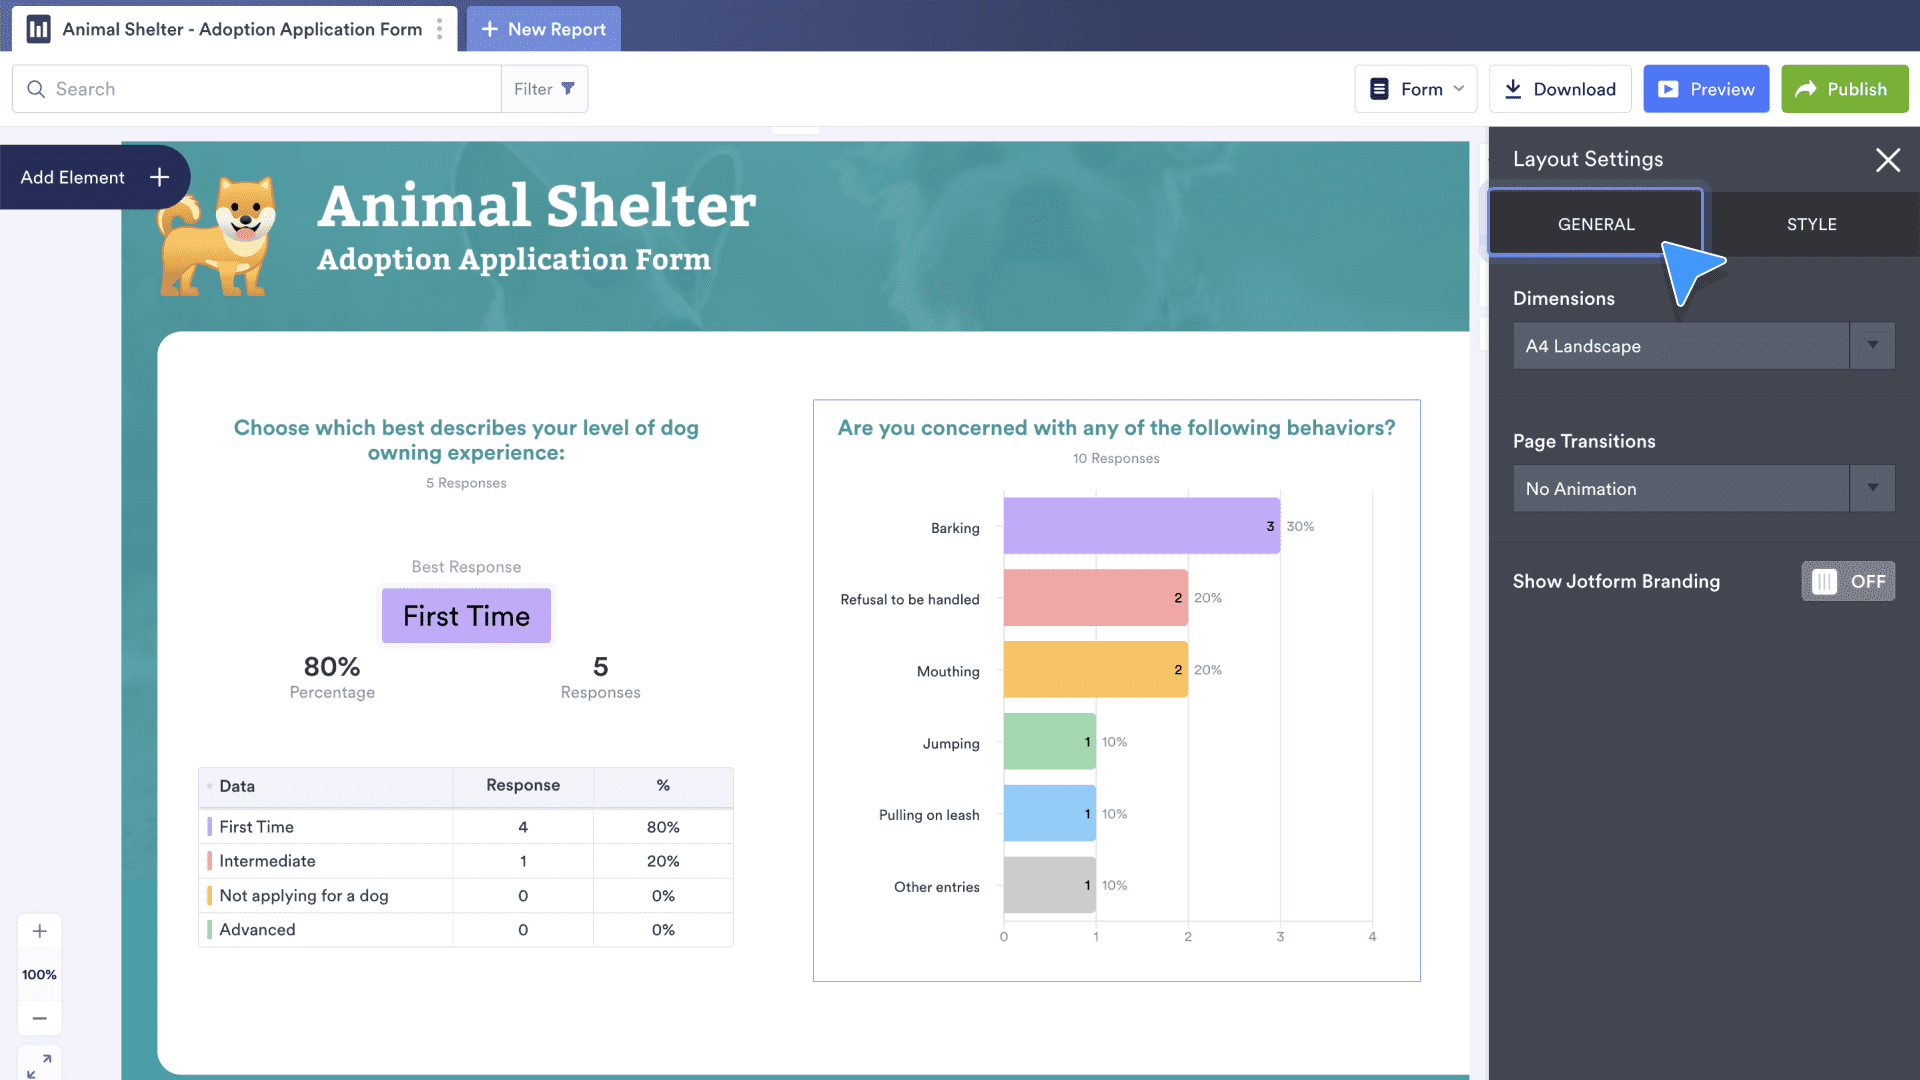
Widening the lens a bit, the Slide Settings and Layout Settings can alter the look of an entire report or slide. Access the Layout Settings using the paint roller icon on the top right of the screen.
In the General tab, use the Dimensions dropdown to alter the size of the slides. There’s a Web option optimized for embedding the report into a website. The Page Transitions setting will add animation to a slideshow presentation of the report. There are Slide, Vertical Slide, Scale and Slide, and Scale and Fade options.
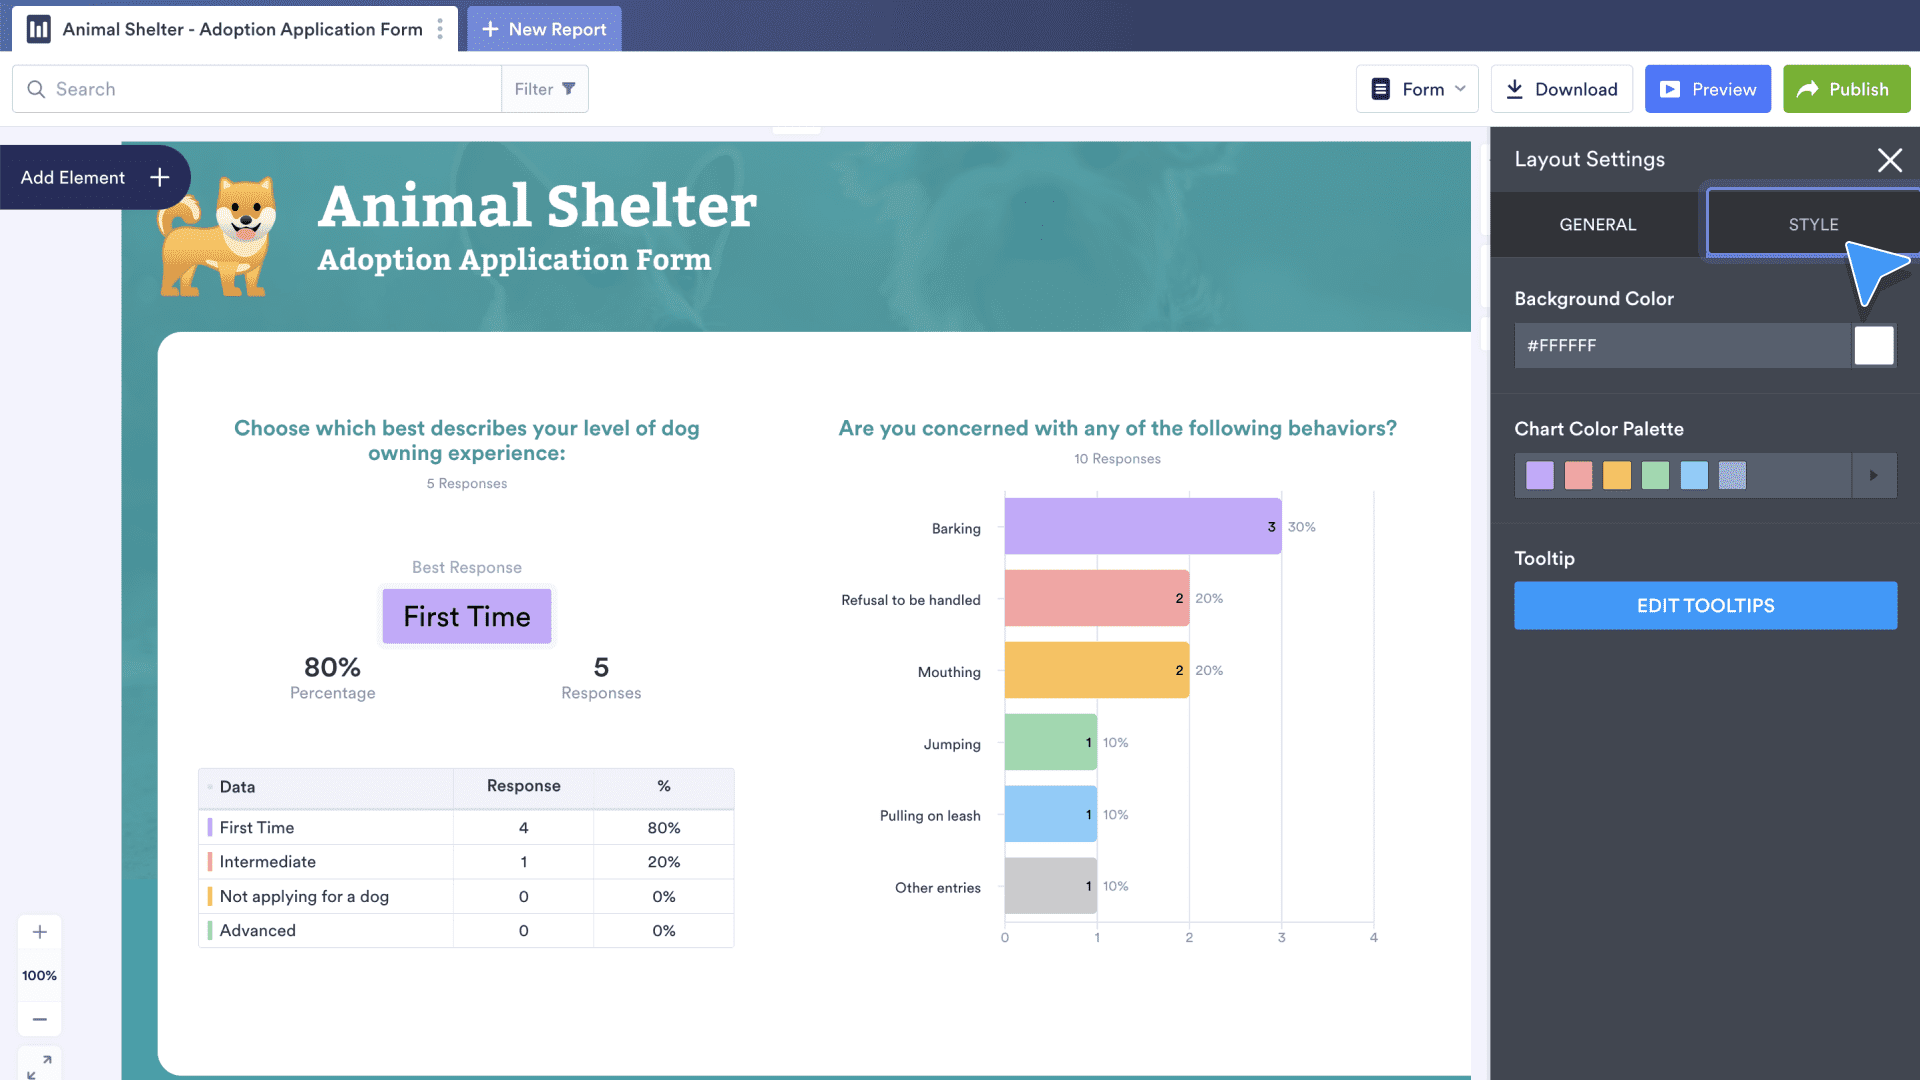
The Style tab of the Layout Settings includes the Background Color option, which changes the background for each slide. Use the Chart Color Palette option to change the color scheme for each chart. There are default color schemes, which can be edited, or you can create a custom set of colors.
The last portion of the Style tab is where you can edit tooltips. (A Tooltip is a popup that appears when a cursor hovers over an image on the screen.) Click Edit Tooltips to turn tooltips on or off, edit the appearance of the tooltip, and change the data displayed by the tooltip.
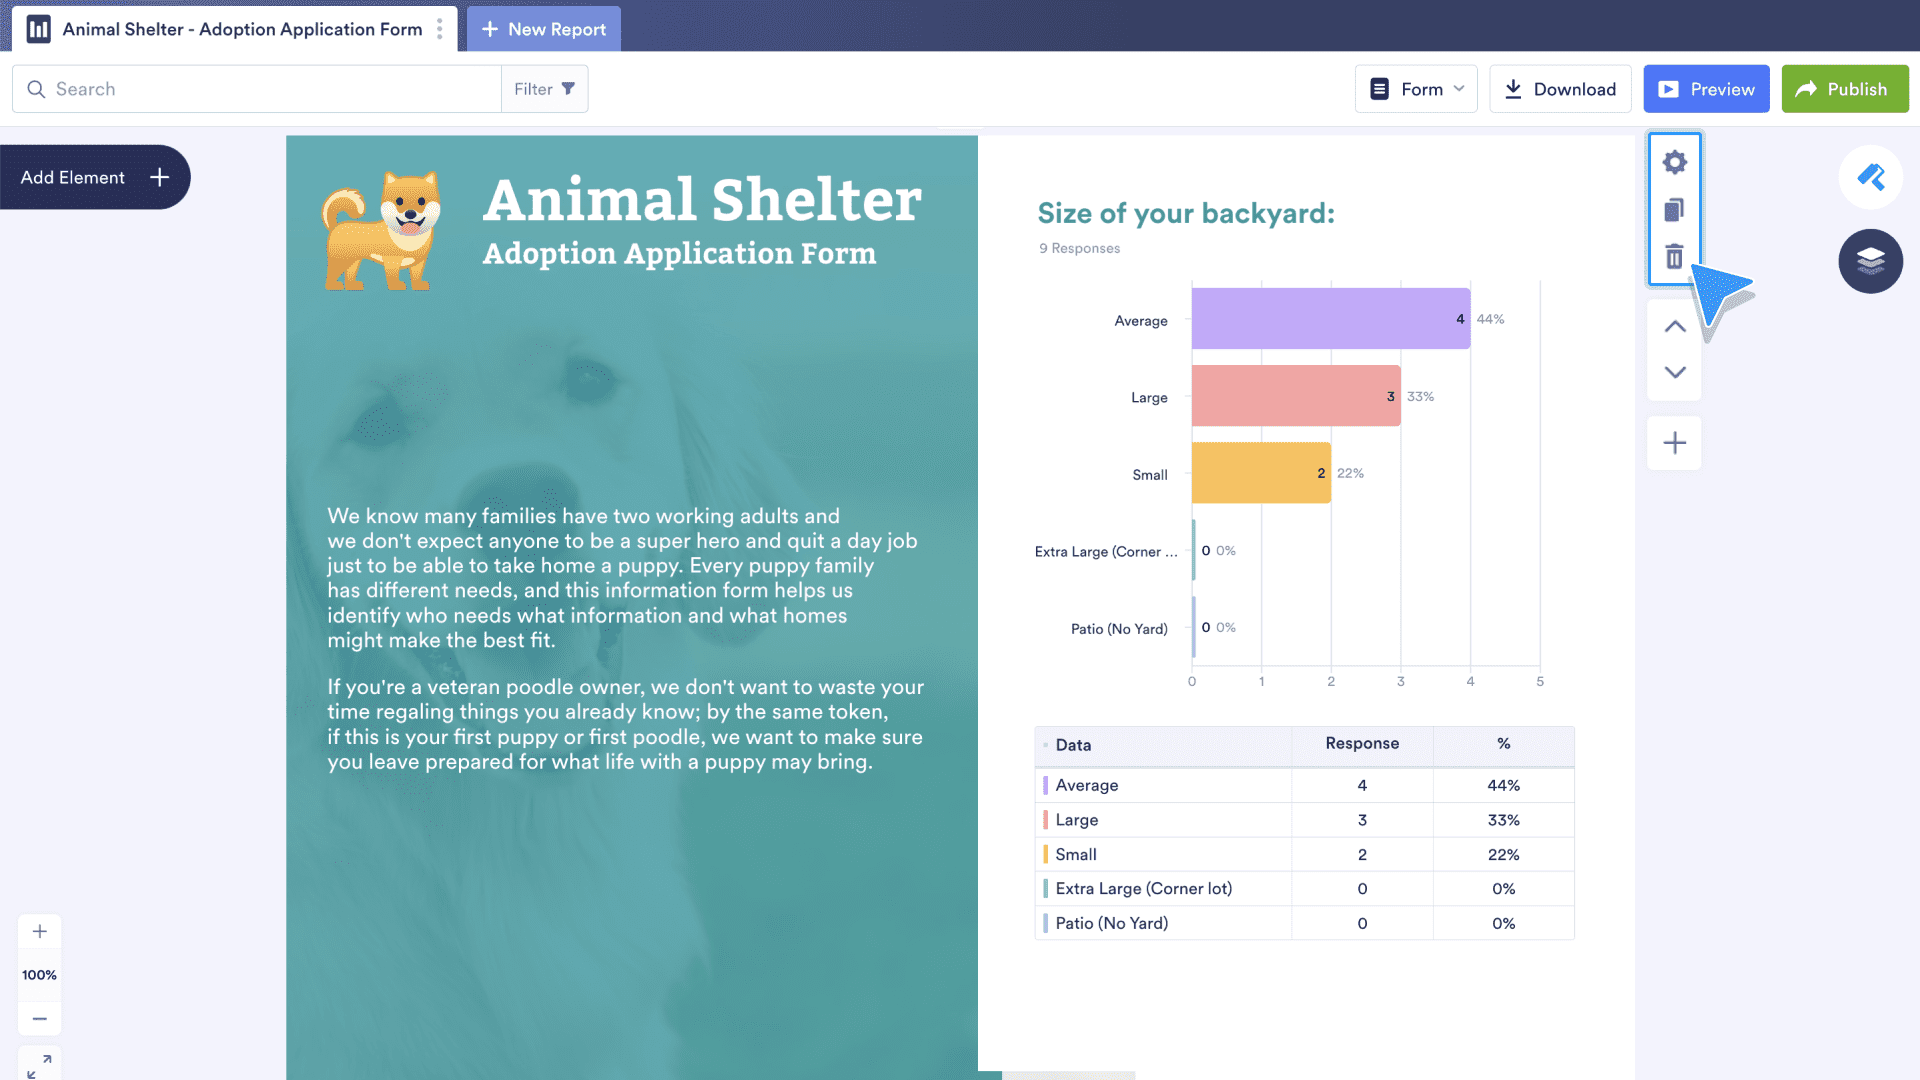
To access the Slide Settings for any single slide, click the gear icon to the right of the slide. Below that is an icon that duplicates the slide and a trash can icon that removes the slide. The arrows will move the slide up or down in the report. A plus sign at the bottom of this section will add a new, blank slide.
Use the Slide Settings to change the background color and quickly hide or unhide slide elements. Each element on the slide is listed in the Slide Settings. Click any of the corresponding checkboxes to remove that element.
Share options including Embed and Presentation
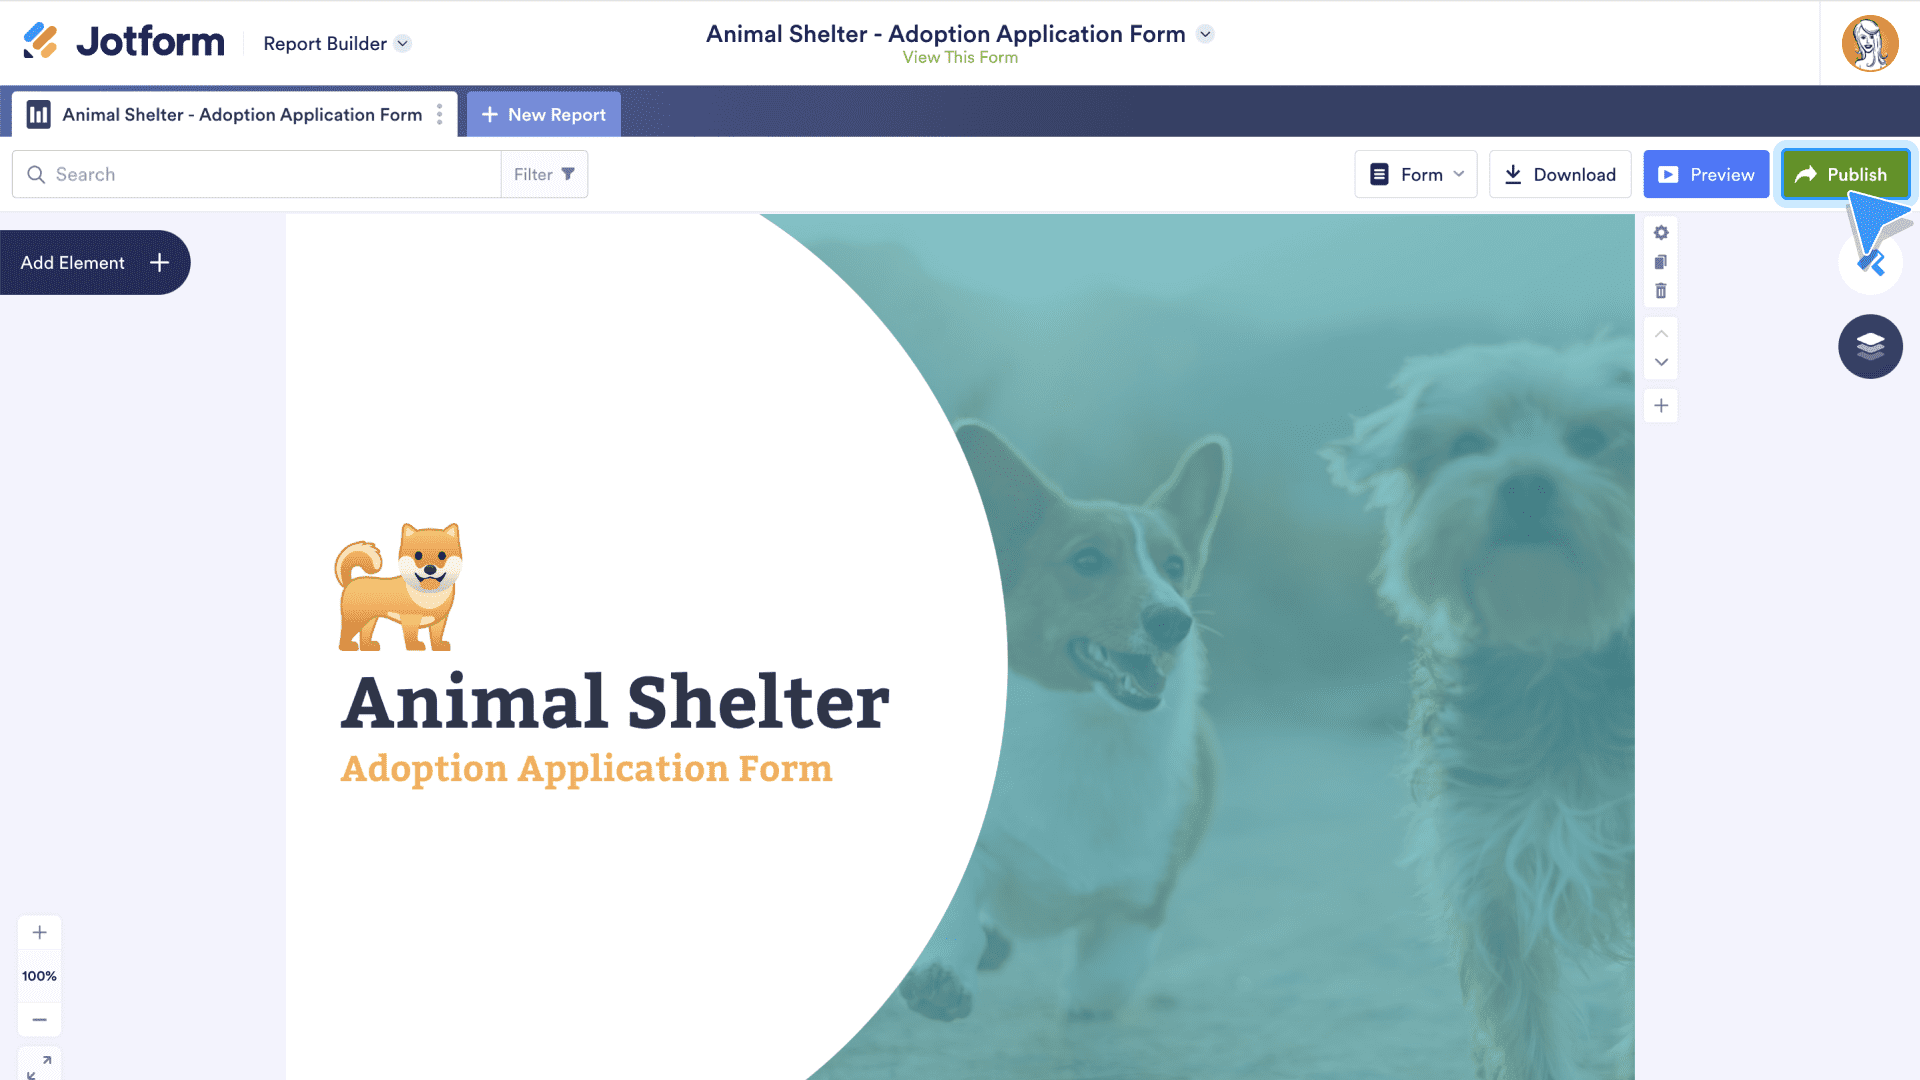
Once a report is ready to show to colleagues, clients, or anyone else with a stake in your data, it’s easy to share using a variety of options available within the Report Builder. To get started, click the Publish button at the top of any report.
Alternatively, select the More dropdown menu from the My Reports page and click Publish.
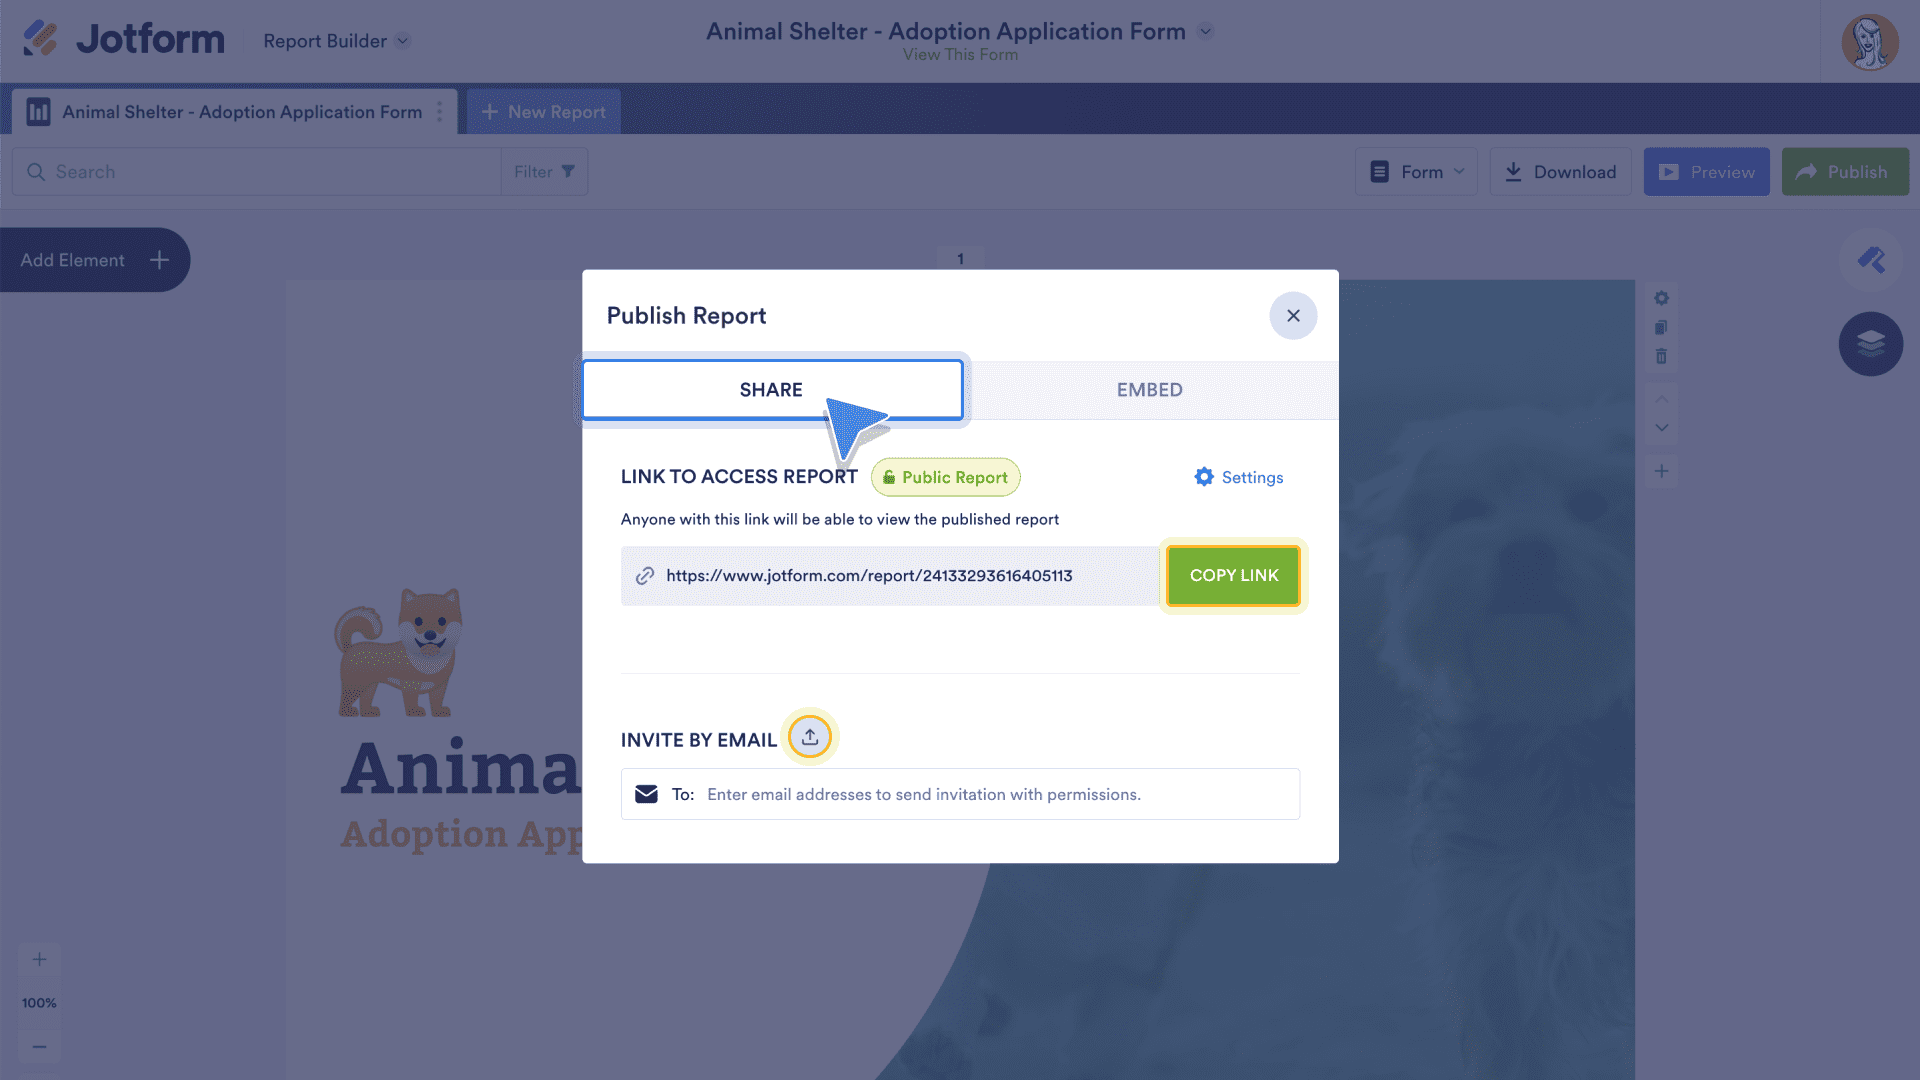
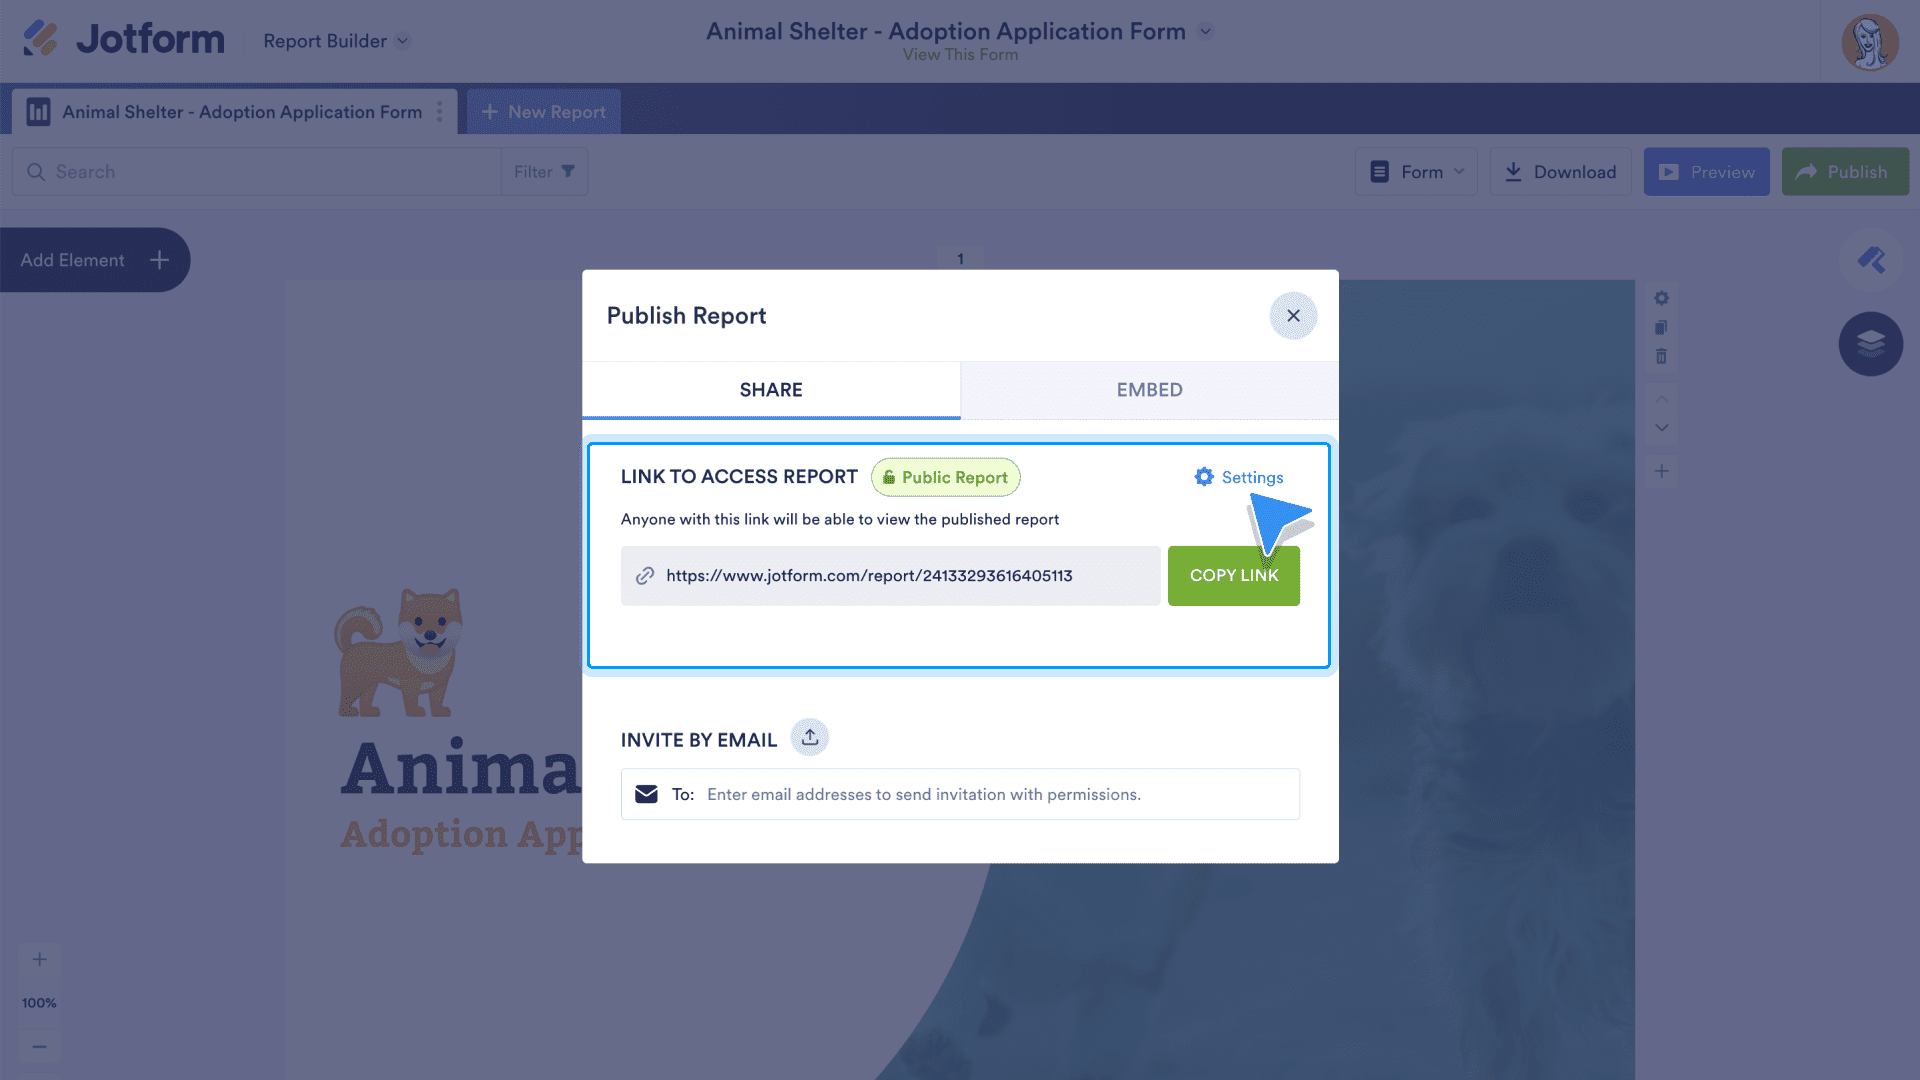
The Publish Report popup has two tabs: Share and Embed. In the Share tab, copy a link to the report for quick sharing. Use the Invite by Email field to enter email addresses manually, or use the upload icon to upload a CSV file of email contacts.
Before going over the Embed options, it’s important to know about the Settings menu, which contains the Access Settings. To open the Access Settings, click the Settings link in the Share tab or click the button next to the Link to Access Report heading, which is set to Private Report by default.
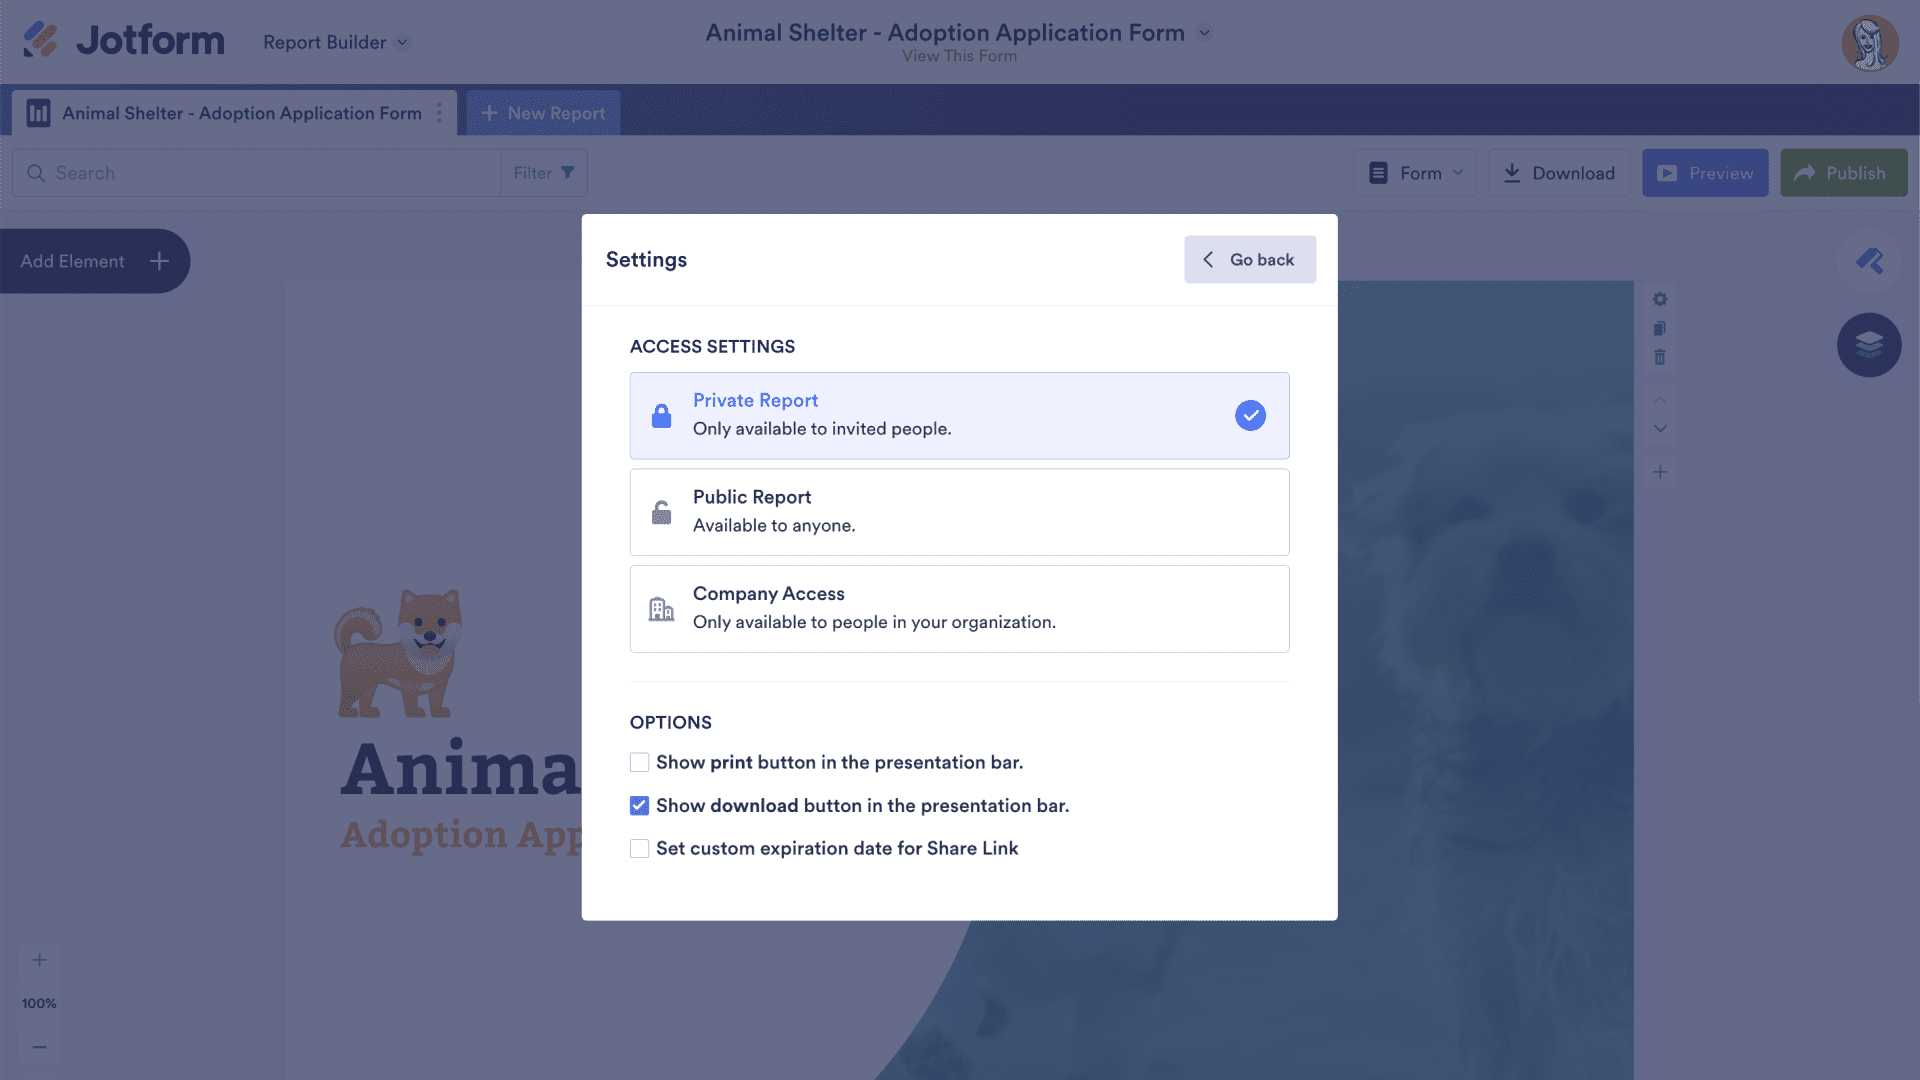
The Access Settings reveal three levels of access: Private Report, Public Report, and Company Access. When access is set to Private Report, embed options won’t be available in the Embed section. Options within the Private Report settings include showing or hiding the print and download options while presenting a report, and setting a custom expiration date for any share link you send to others.
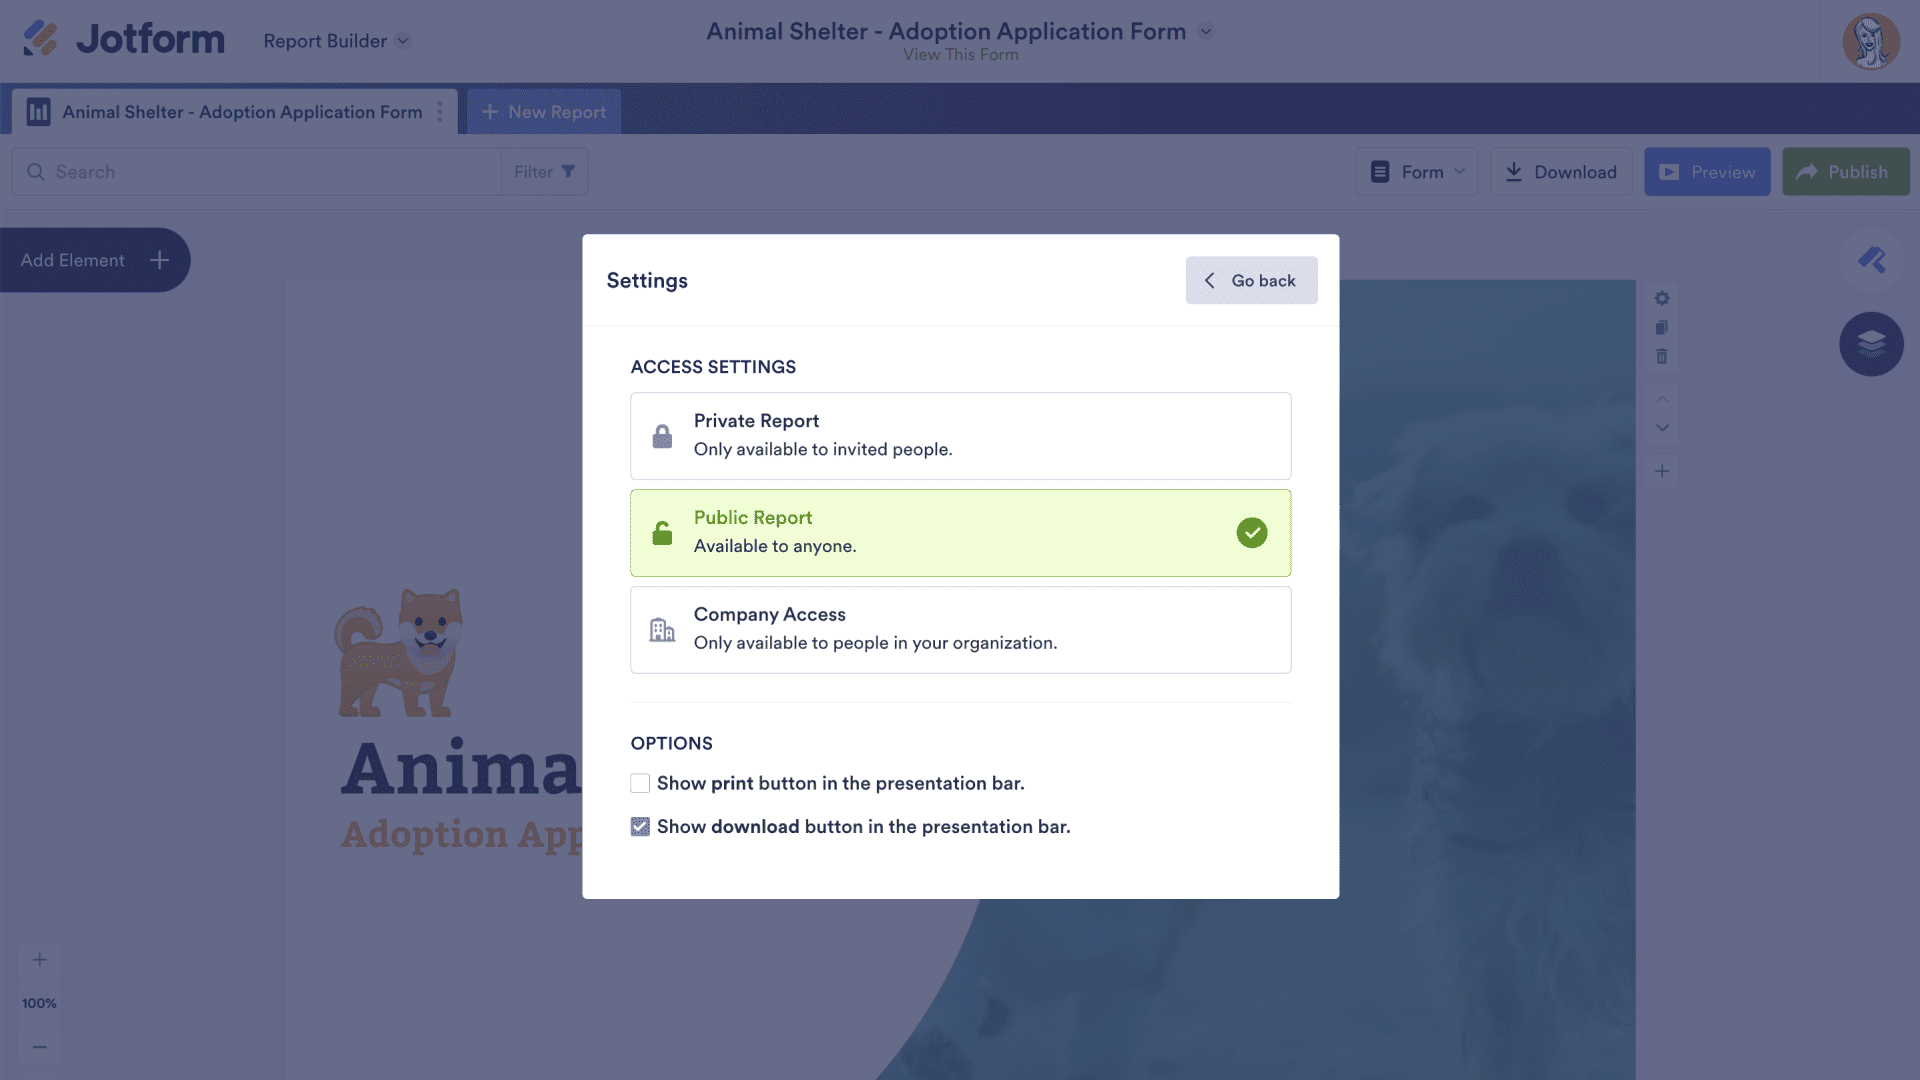
When access is set to Public Report, the report is available to anyone, and the embed options in the Embed menu will be available. Options include showing or hiding the print and download buttons while presenting a report.
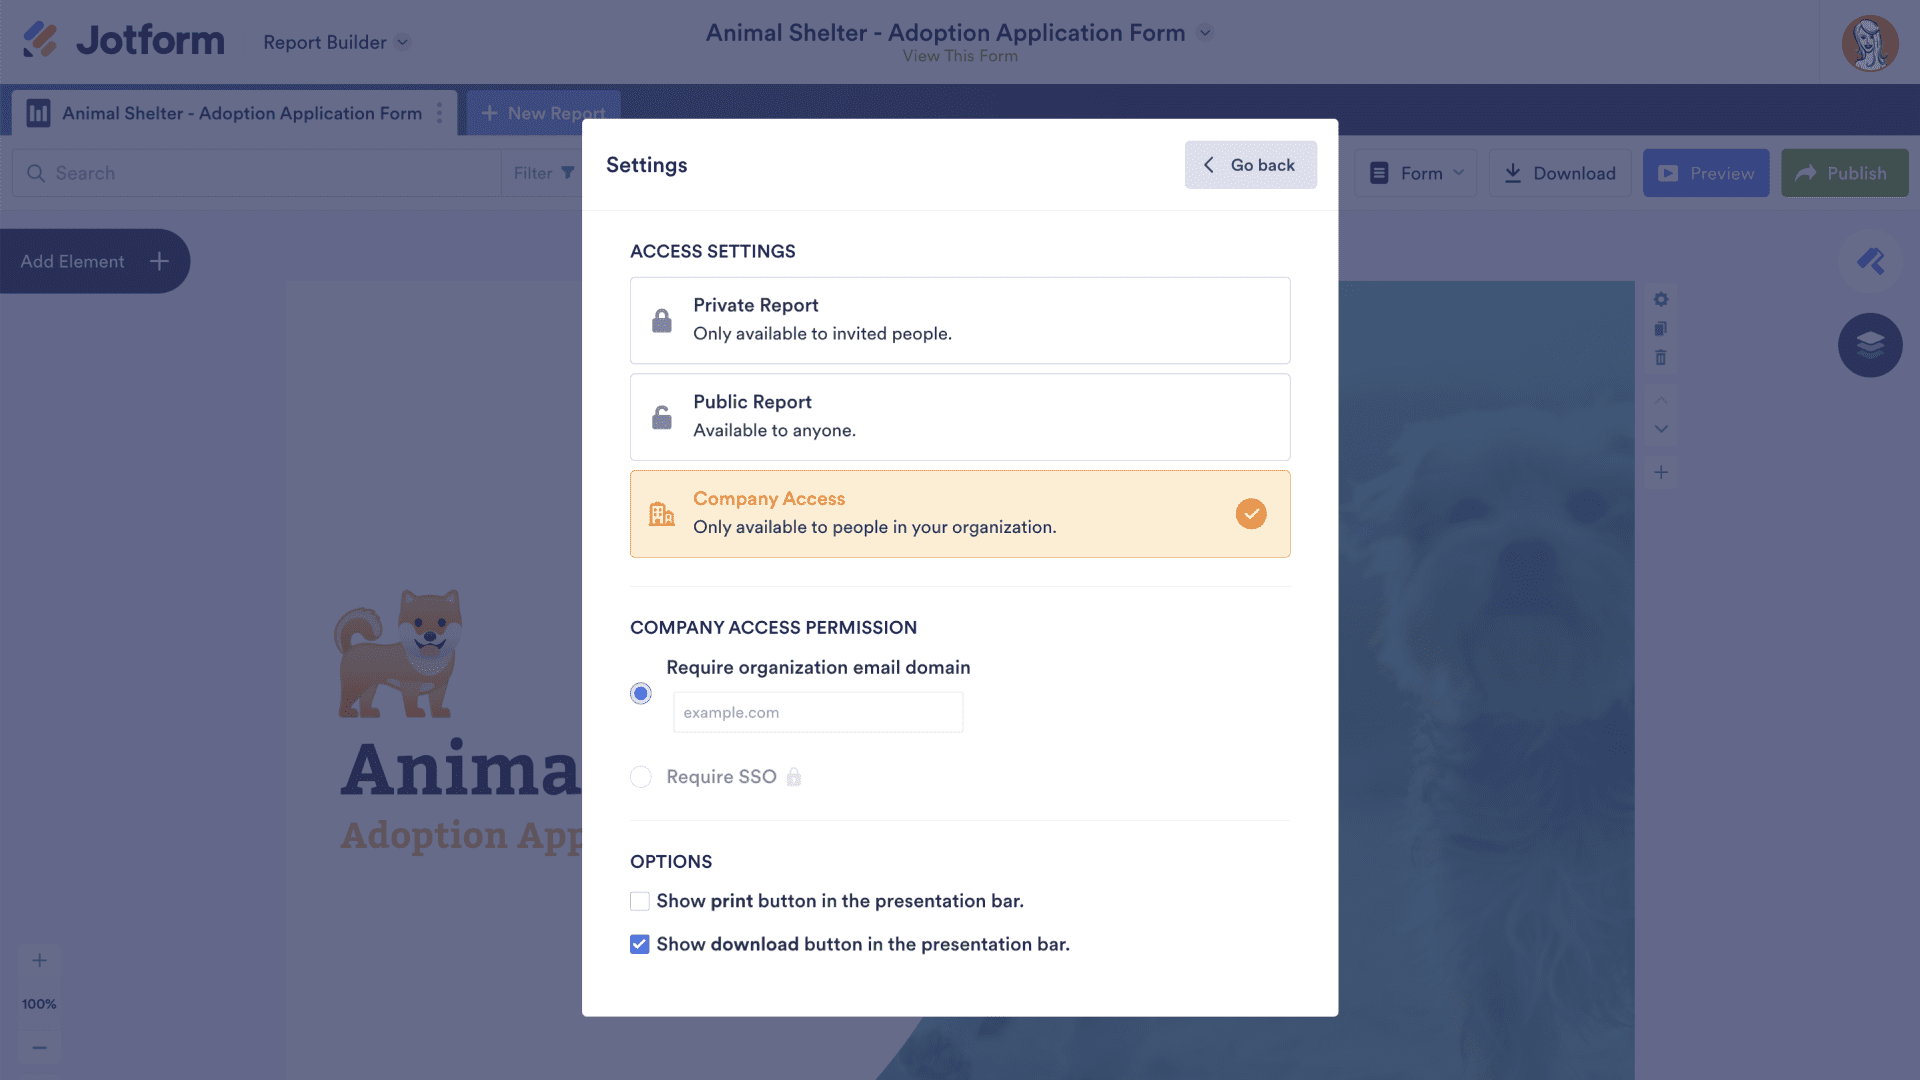
Company Access means the report is viewable only to people in your organization. You can require your organization’s email domain to ensure company access. Jotform Enterprise clients can require a single sign-on login (SSO). Other options remain the same: Show or hide the print and download buttons while in presentation mode. Embed options are available for reports set to Company Access.
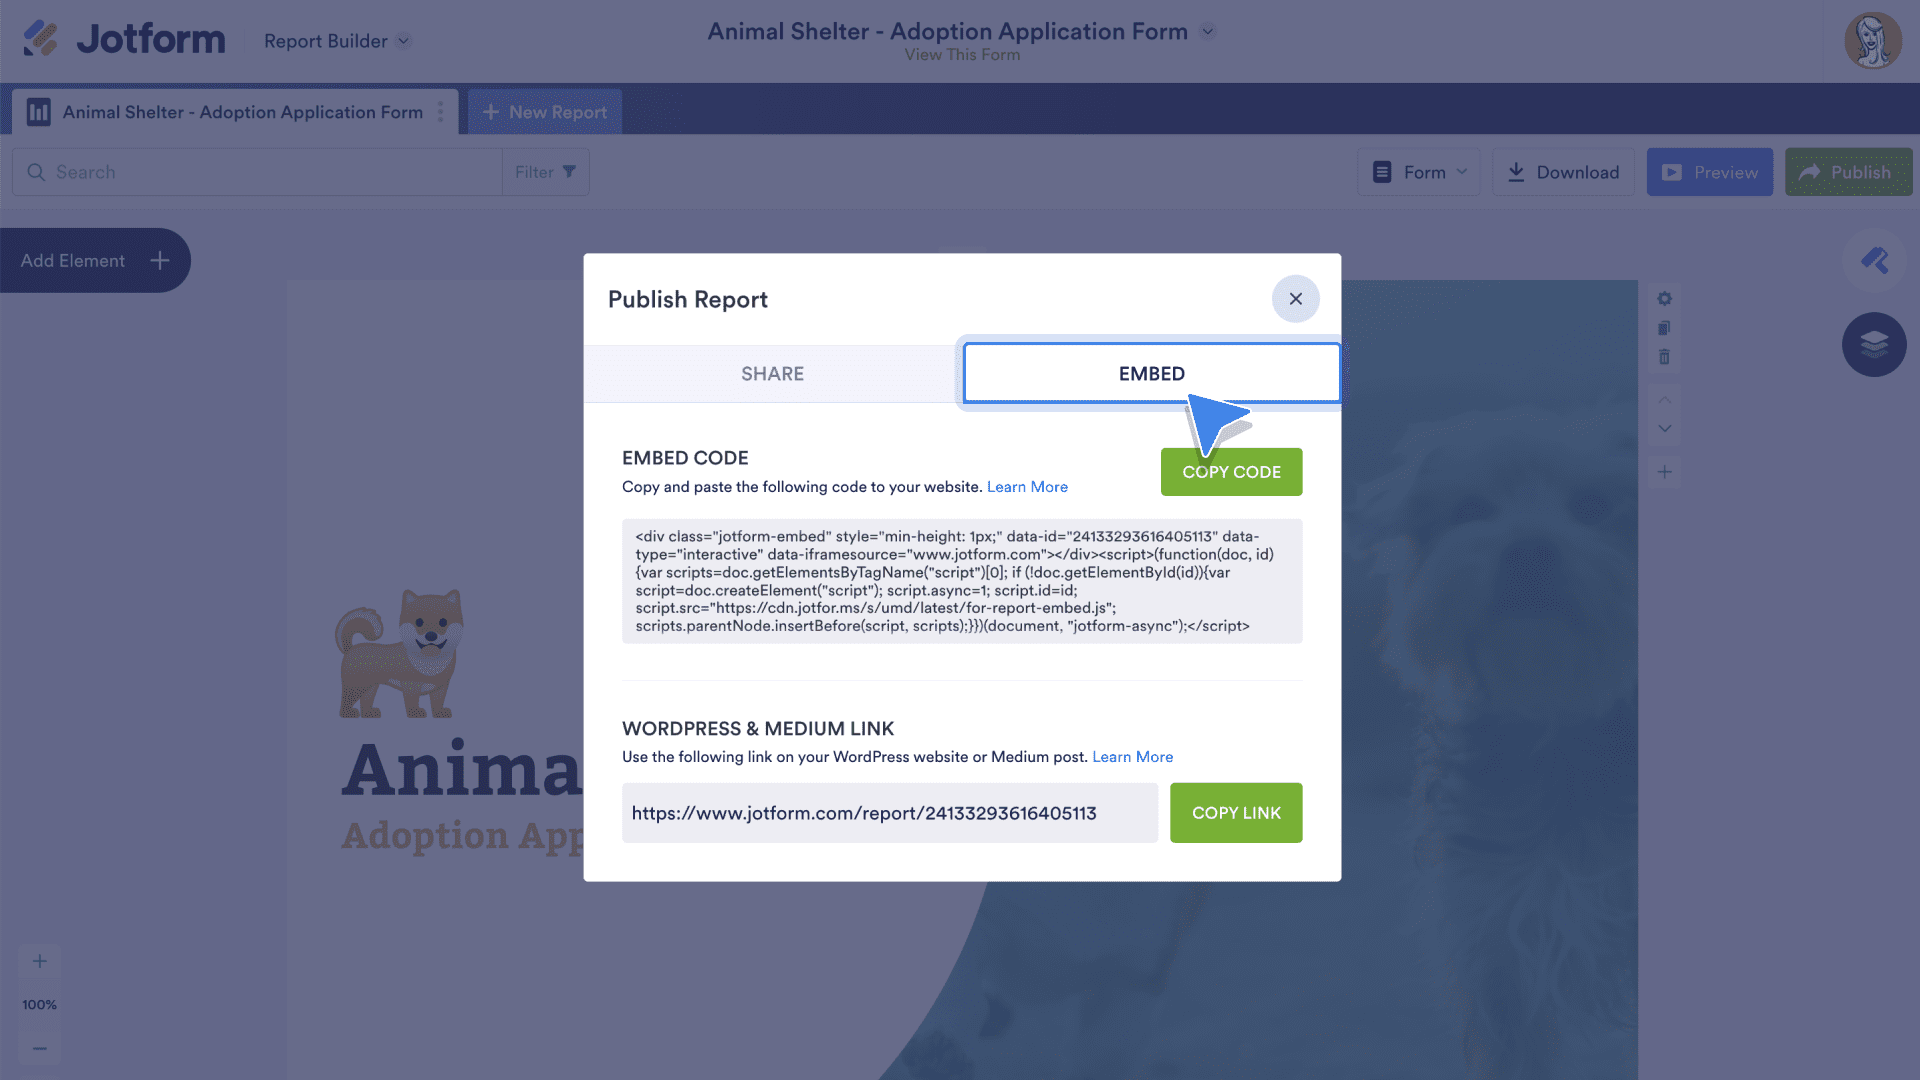
The Embed tab of the Publish Report settings includes an embed code. Copy and paste this code into your website to embed the report. At the bottom of the Embed tab is a link that’s suitable for WordPress and Medium websites.
An embedded report will update automatically as new submissions are received.
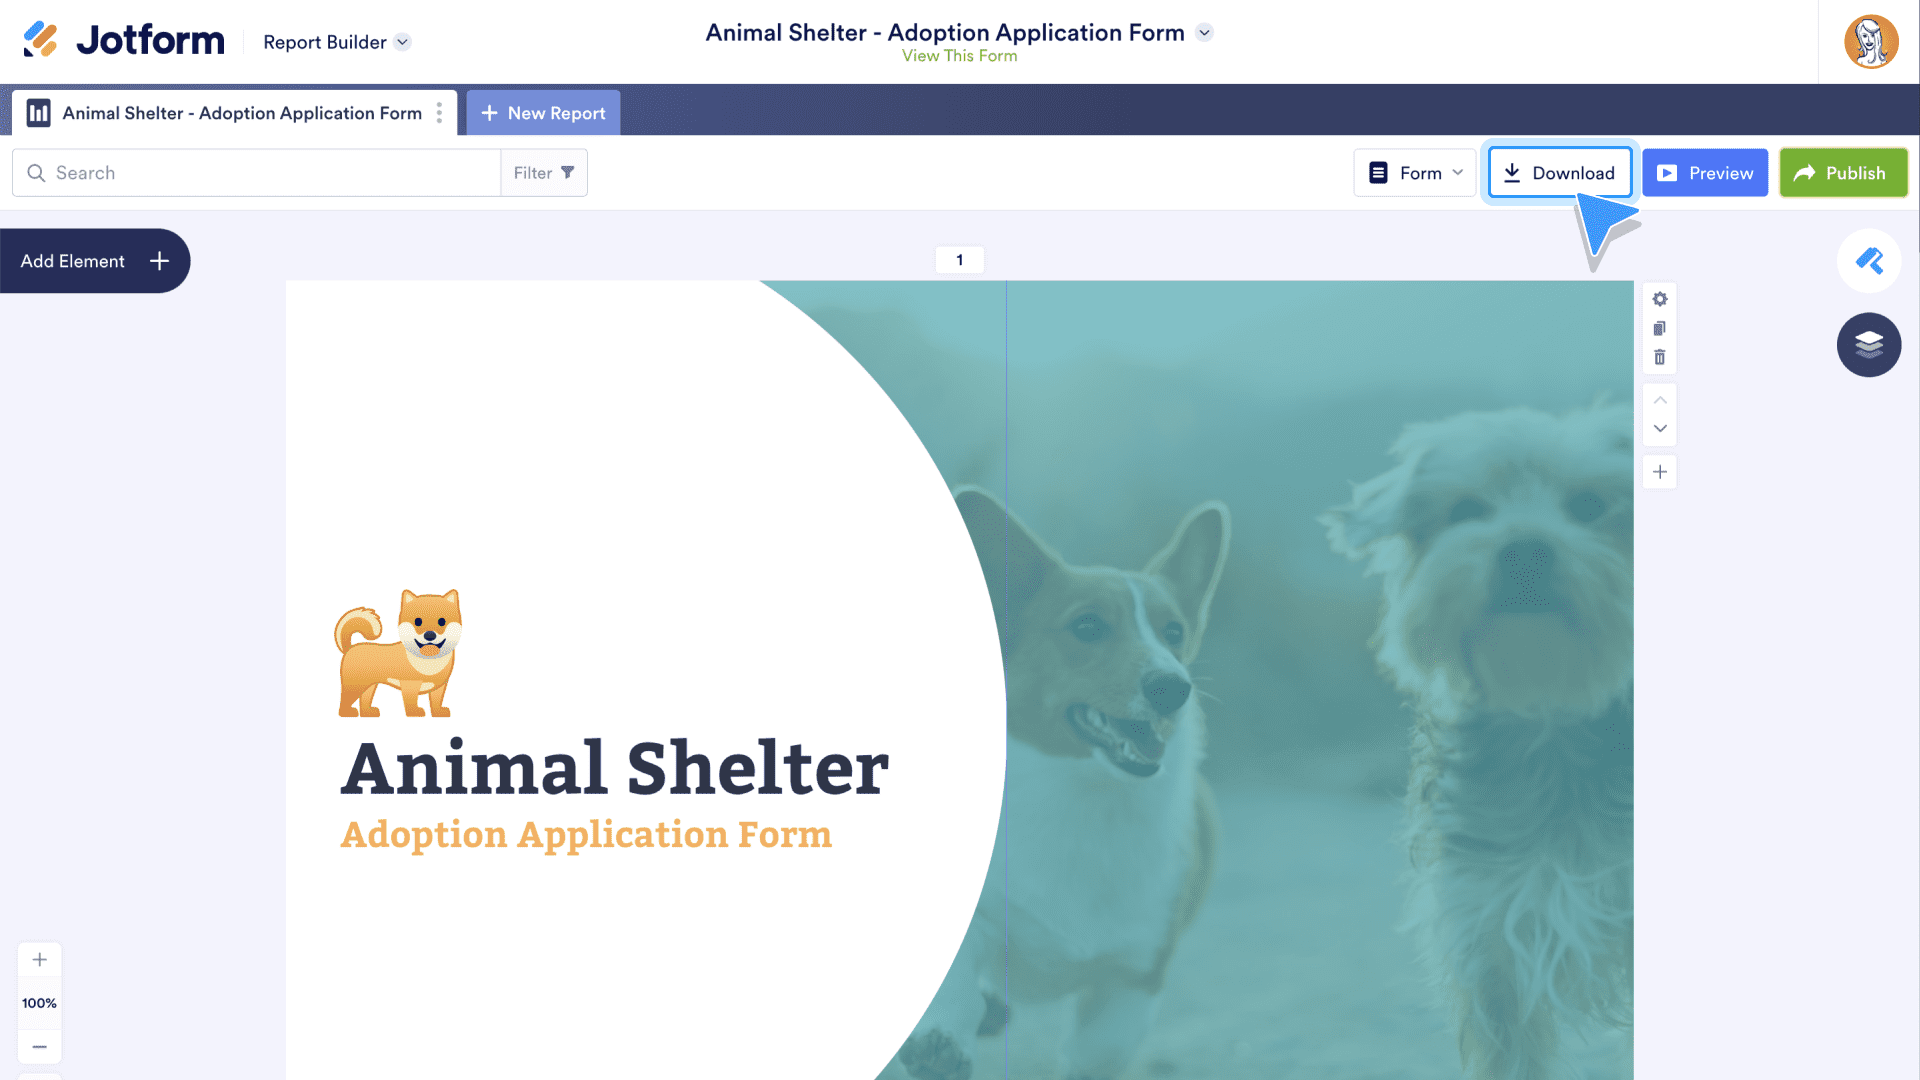
To download a PDF of a report to share via email or other methods such as Quick Share and AirDrop, click the Download button at the top of the Report Builder. Note that just like the Publish button, the Download option is also available via the My Reports page.
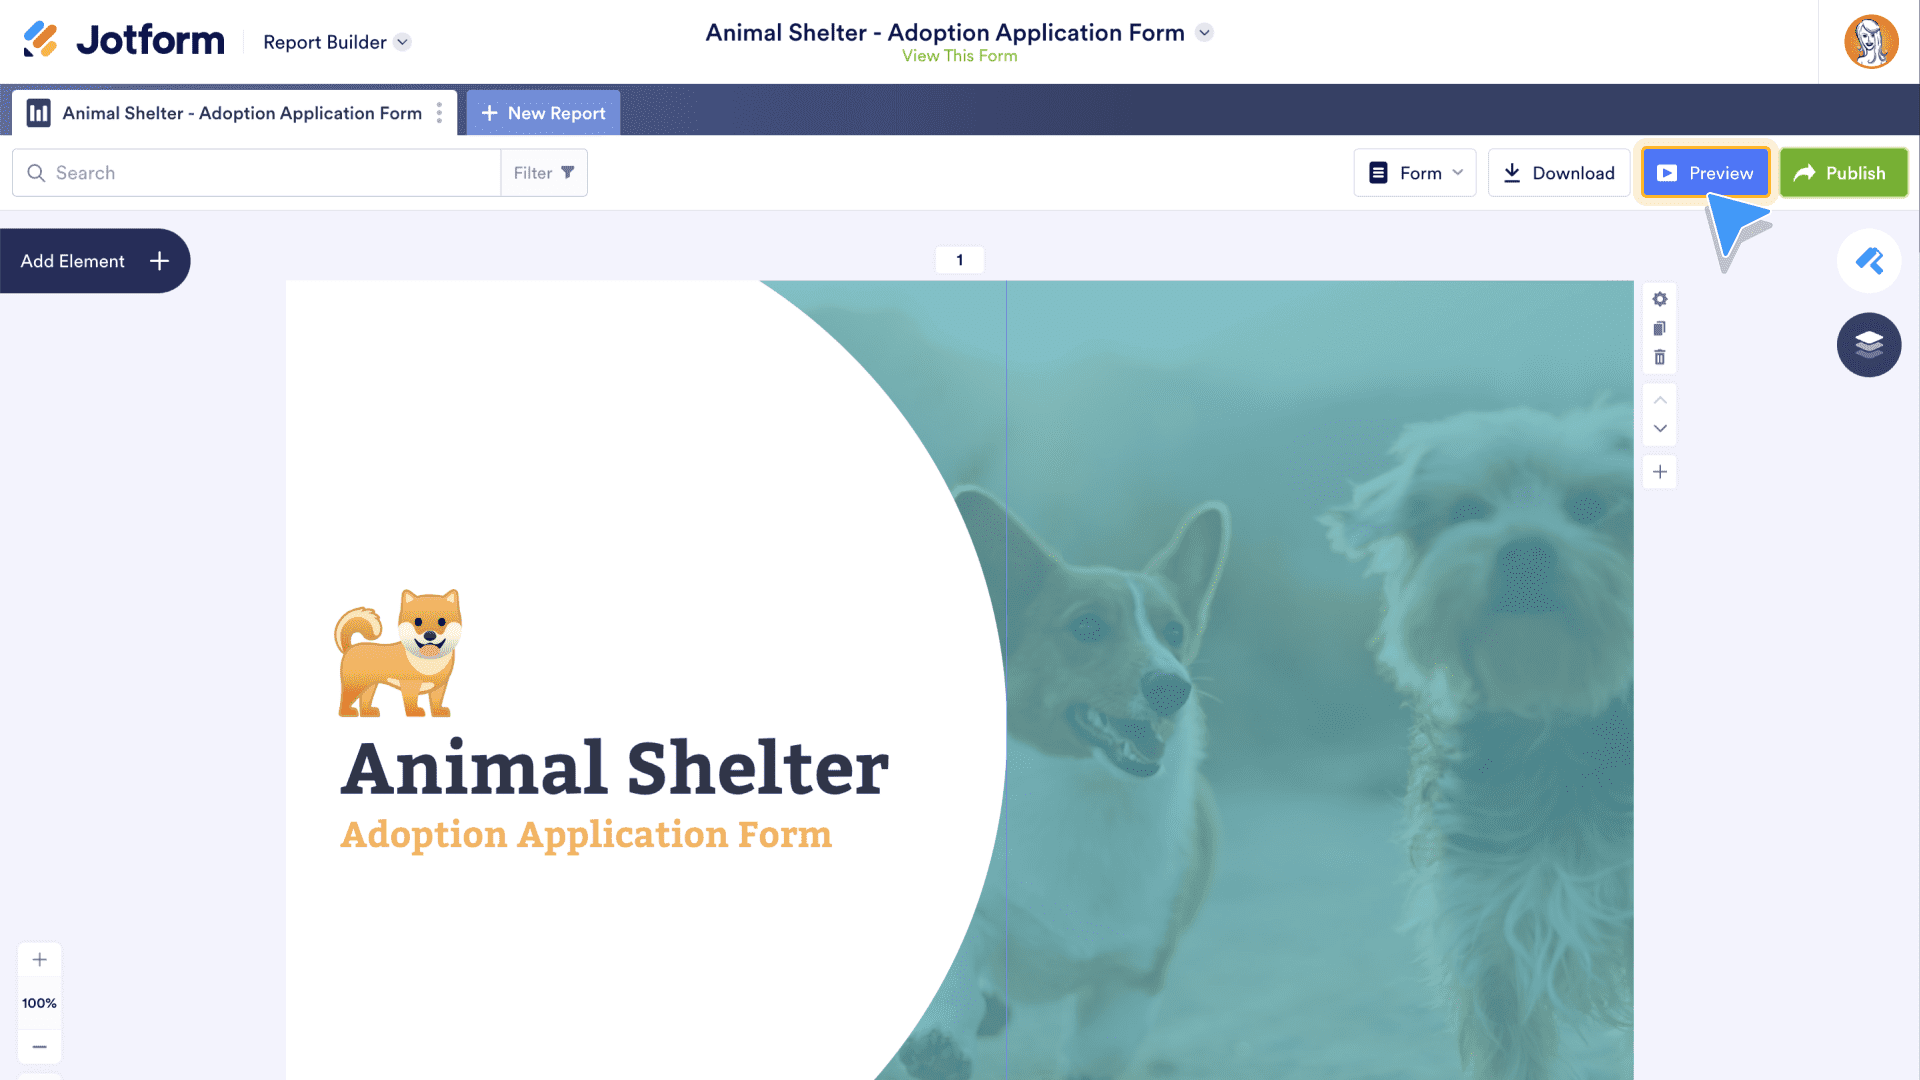
To print a report or share it with a live audience, click the Preview button. Notice that the button also has a “play” icon, designating presentation mode.
On the following screen, click the report expansion arrows in the toolbar next to the print and download options.
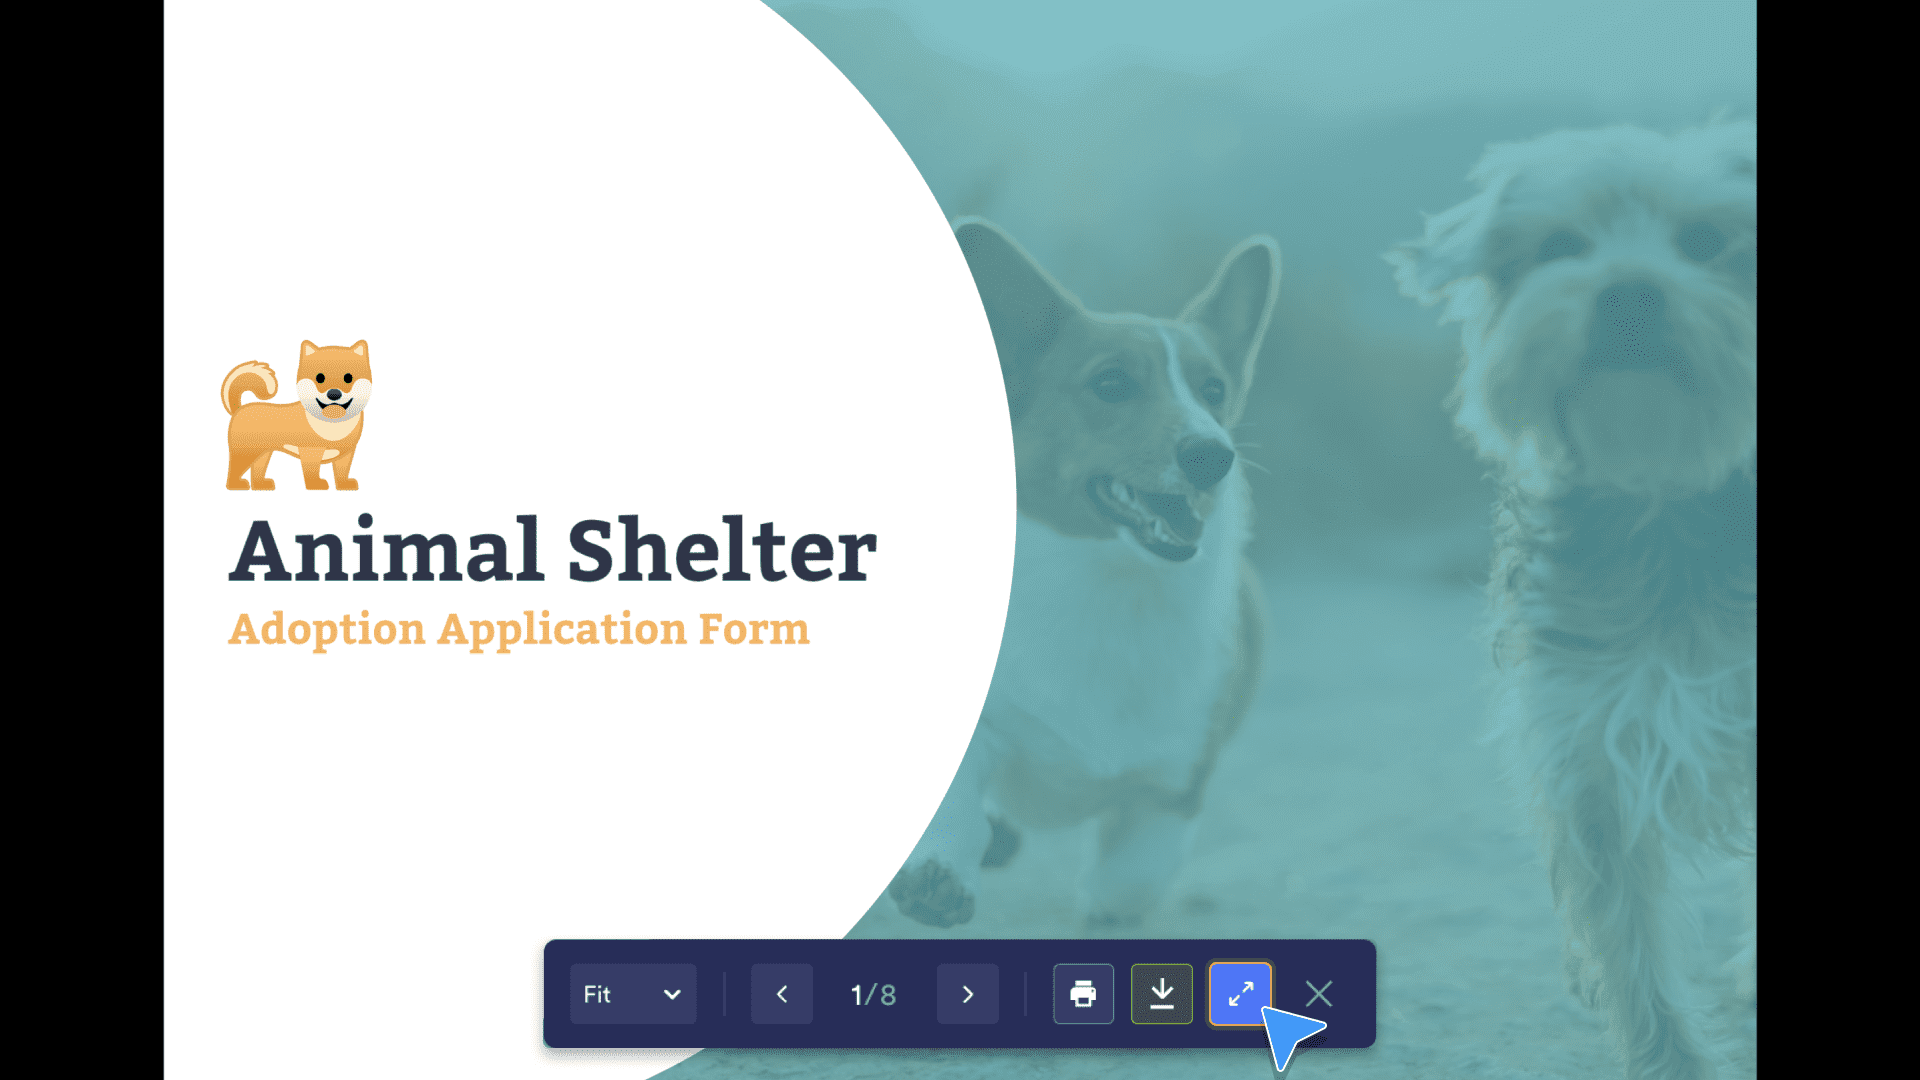
The report will expand to fill the screen. Use the toolbar to switch from slide to slide, or move your cursor to the side of the screen. The toolbar will disappear, allowing the presenter to use the arrows on their keyboard to move the presentation along. Any slide animation features activated via the Layout Settings will appear as you do so. When finished, press Escape on your keyboard and then click the “X” in the toolbar.
Filter feature
Visual reports from Jotform Report Builder are a great way to show off your data to colleagues, clients, or anyone else via website embed. But report owners can also view their reports to gain insight into their data.
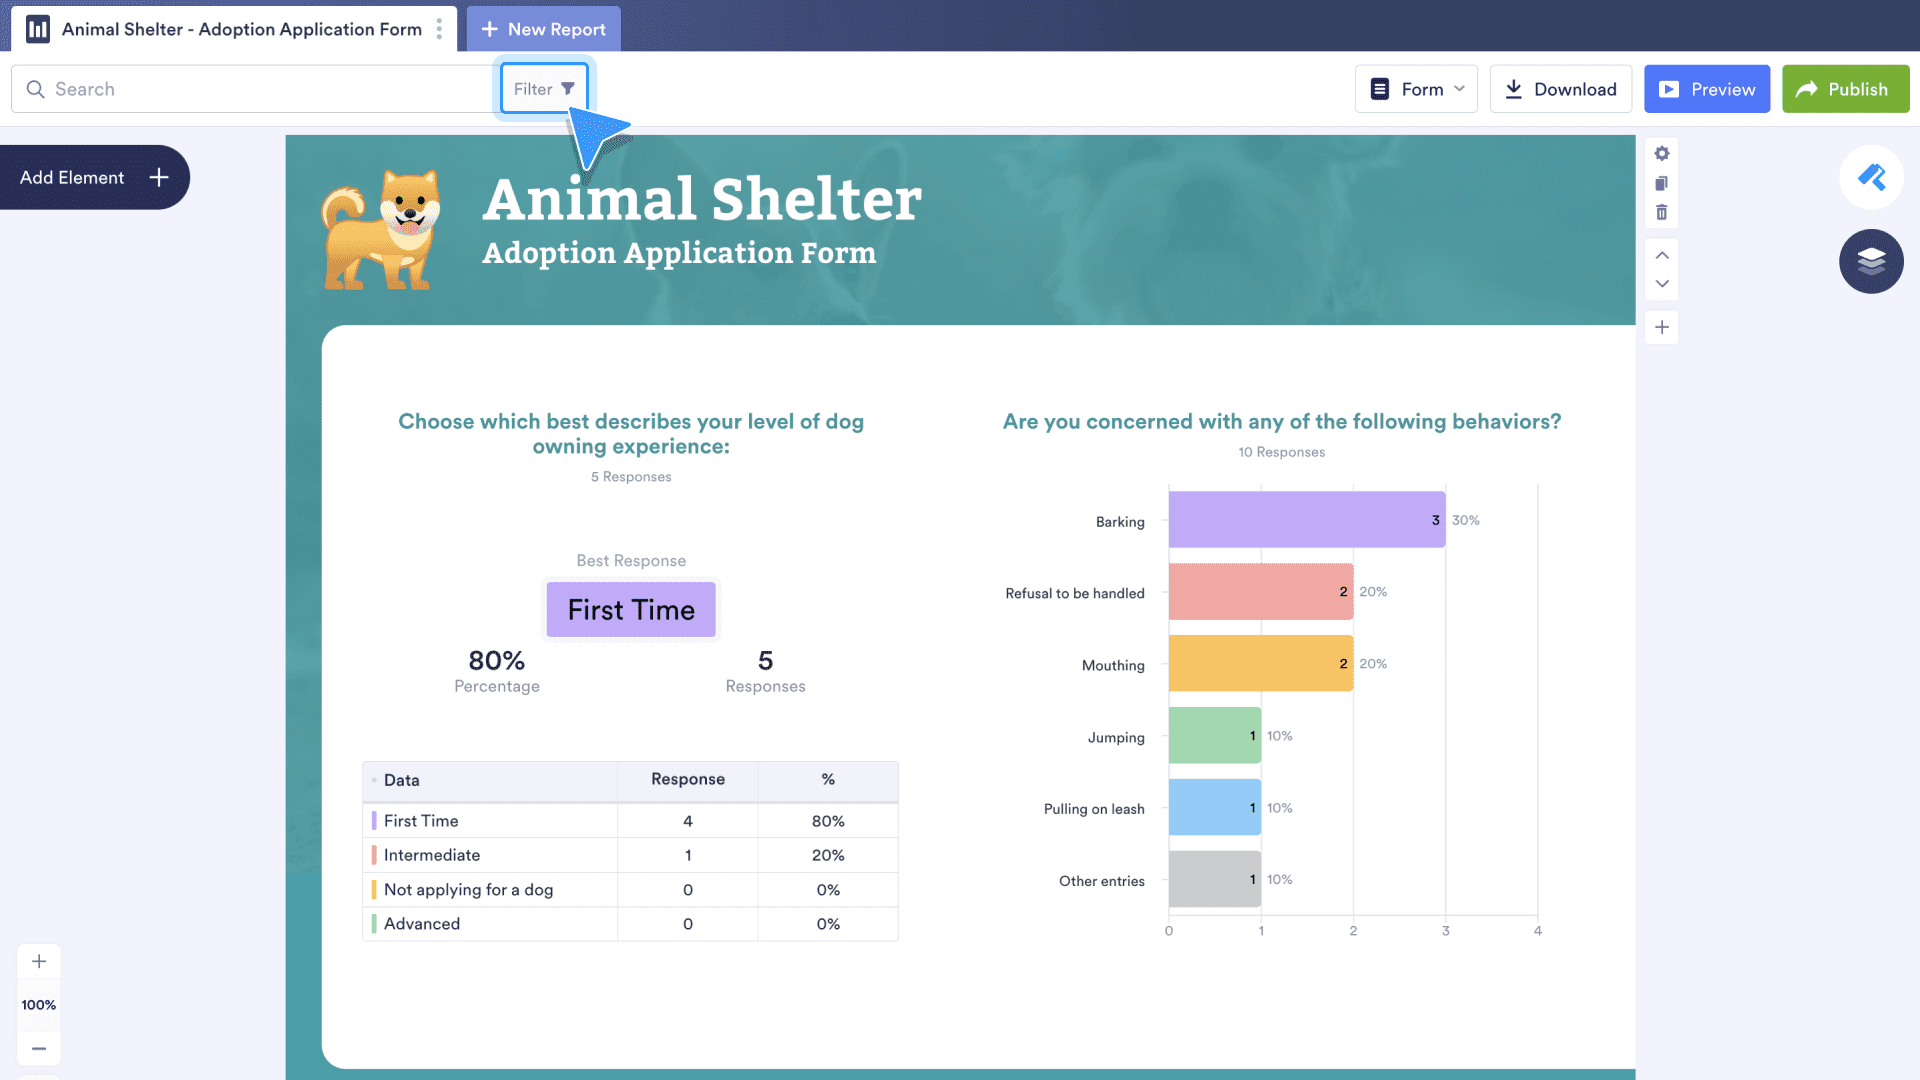
As submission data is added to your report, chances are you’ll want to sift through what you have. For that, the Report Builder offers a filter feature. Filters allow you to better analyze trends and patterns in your form responses by creating rules to determine which results are included in your charts and graphs. Click the Filter button at the top of the screen to get started.
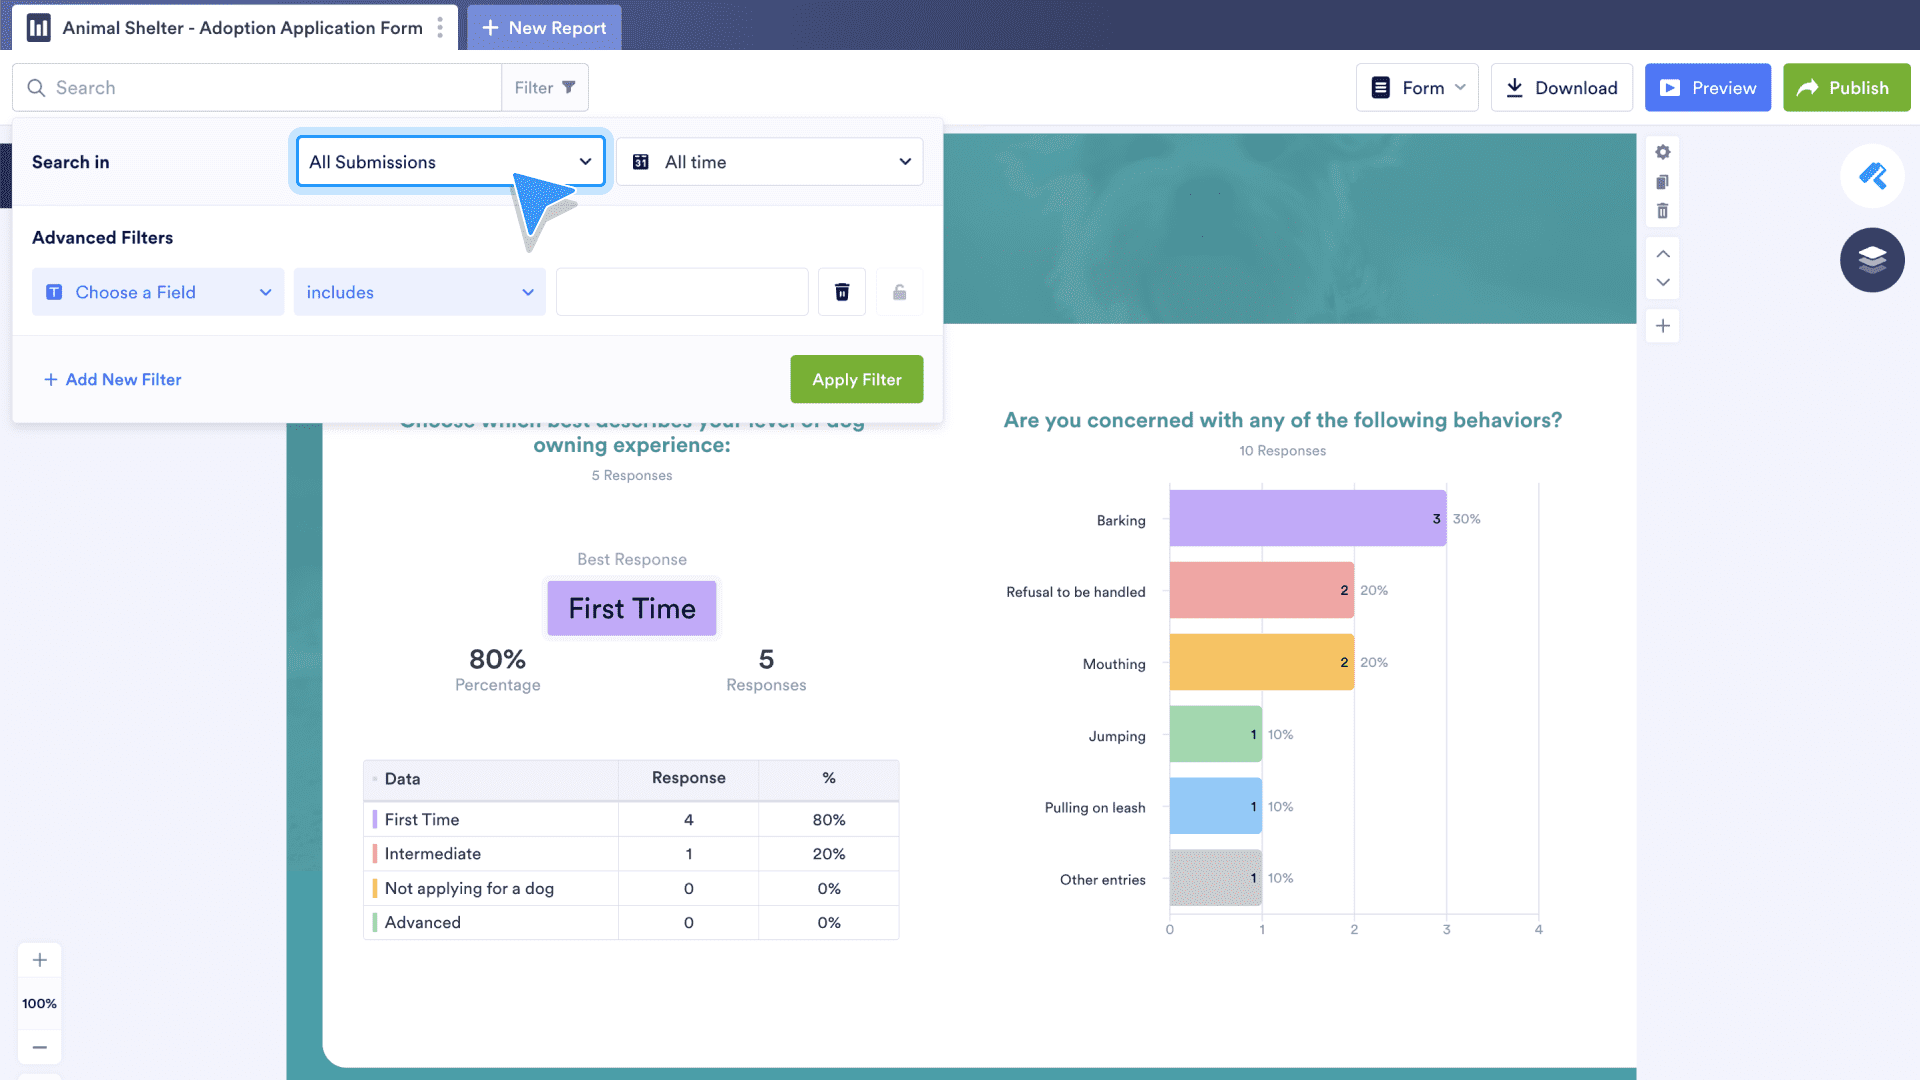
The Report Filter feature is compact but mighty, starting with basic submission parameters. Use the first dropdown menu, which is set to All Submissions by default, to filter by Unread, Read, Starred, and Unstarred submissions.
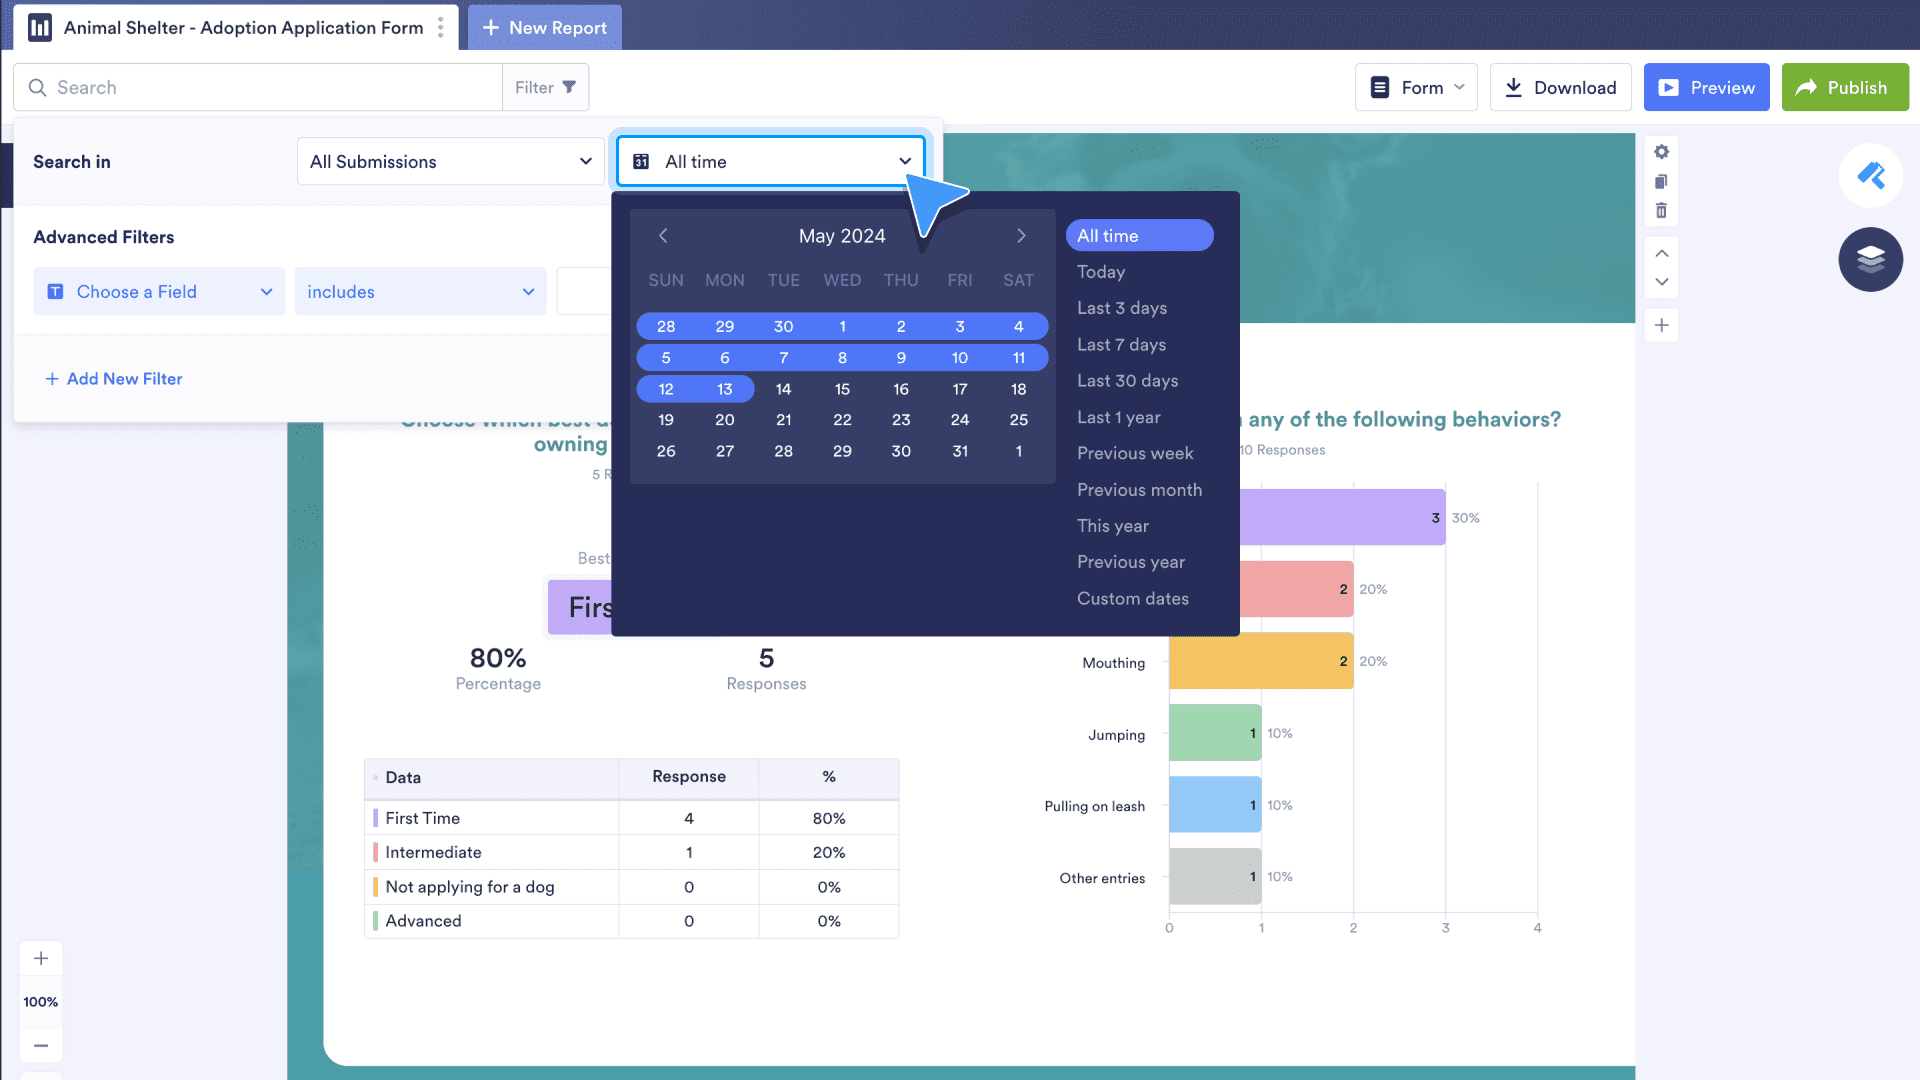
Use the dropdown menu to the right to filter data by submission date. Choose from a robust list of preset time parameters or create a custom timeframe.
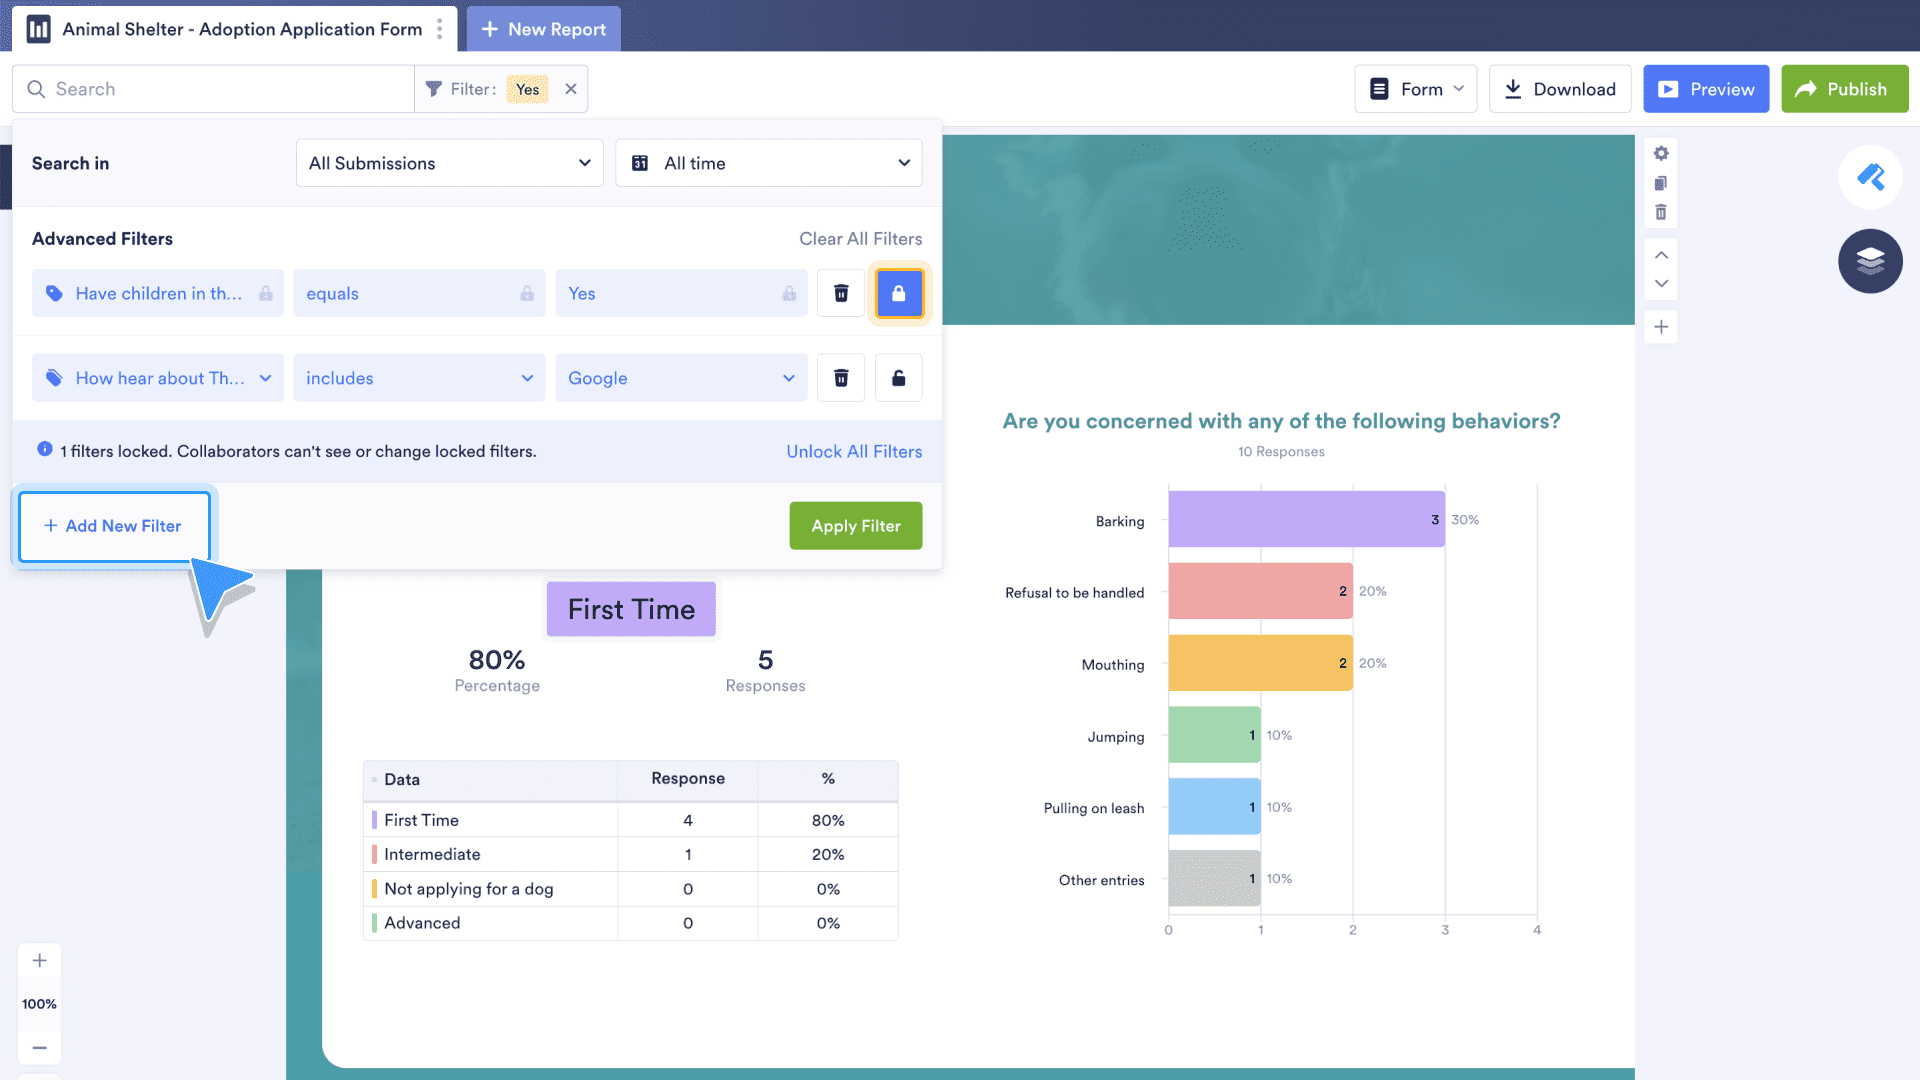
In the Advanced Filters section, use the first of three dropdown menus to choose a Form Field. Remember, these Form Fields represent the charts in your report. In the next dropdown menu, choose whether you want your filter to include, equal, or not equal the answer selected in the third dropdown menu.
In the example below, the filter will identify submissions that answered “Yes” to the question “Have children in the home been around animals before?” When the filter is all set, click the Apply Filter button.
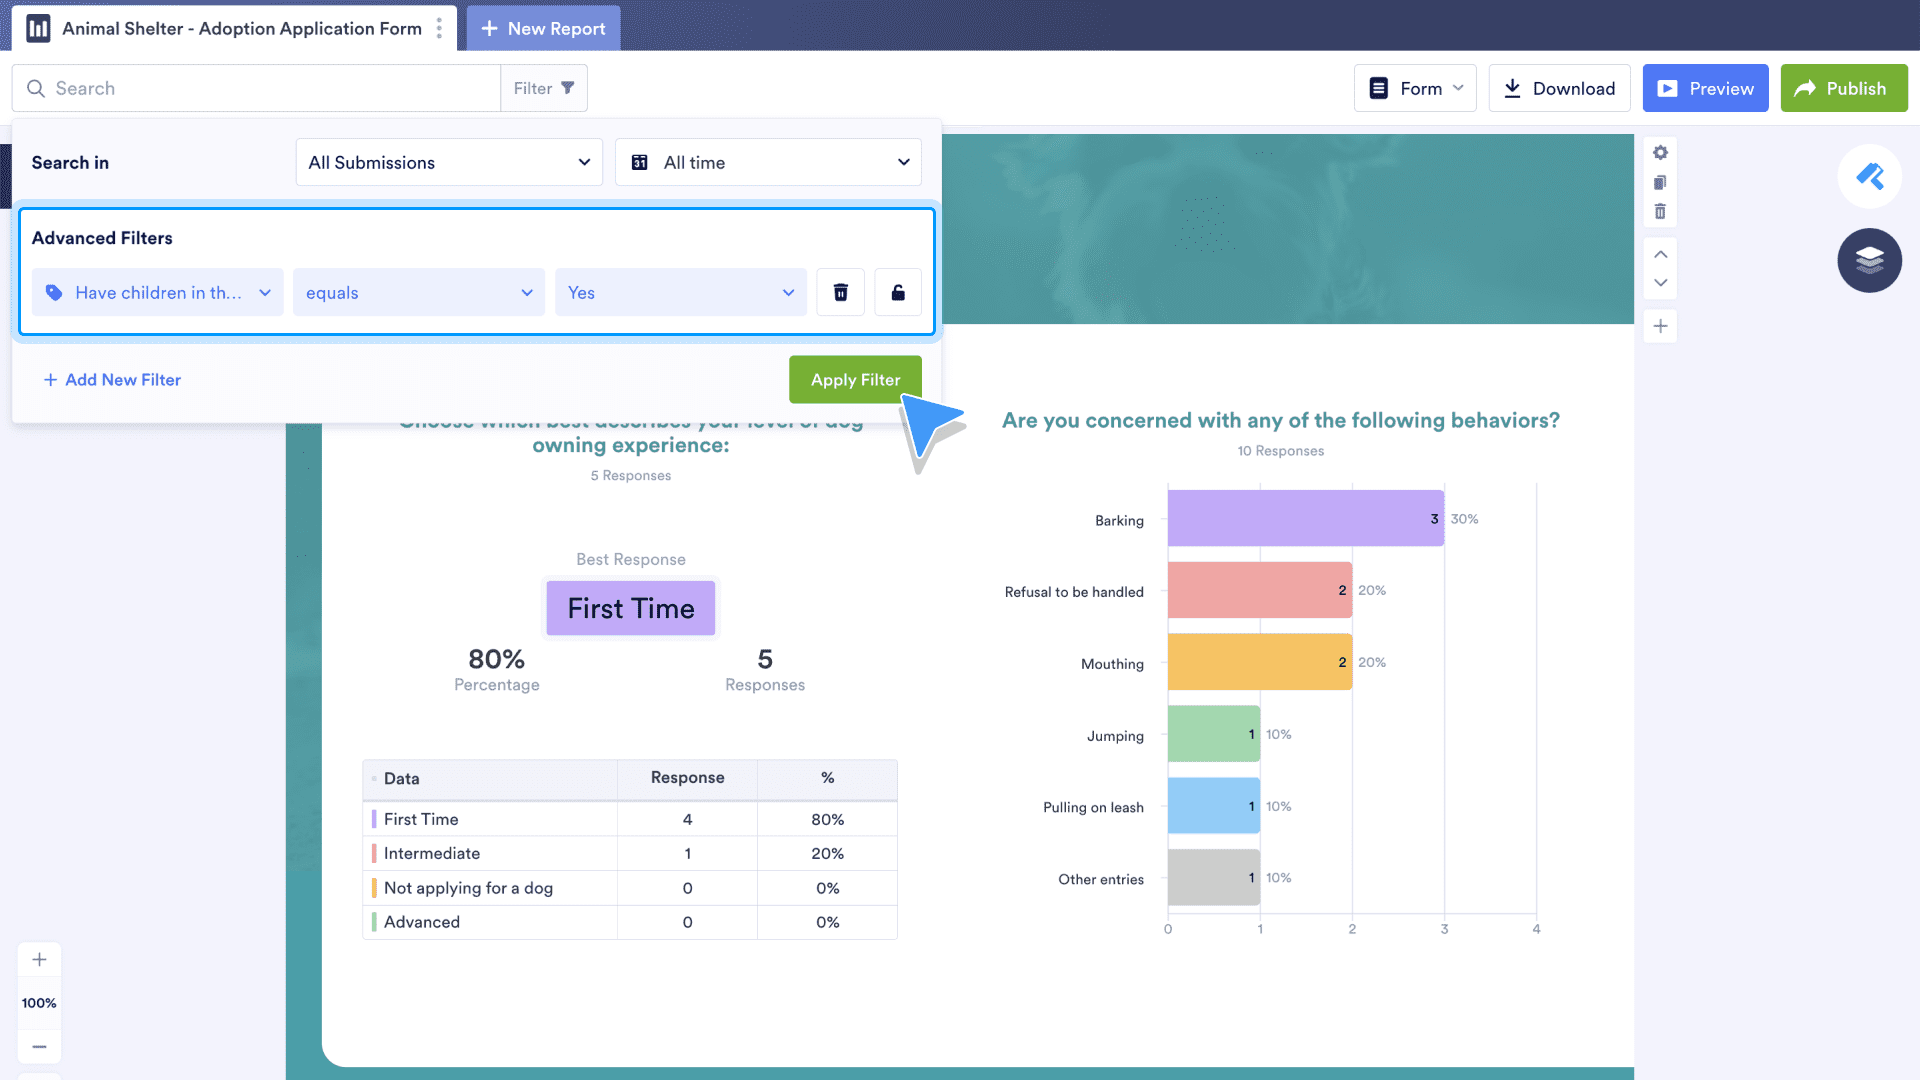
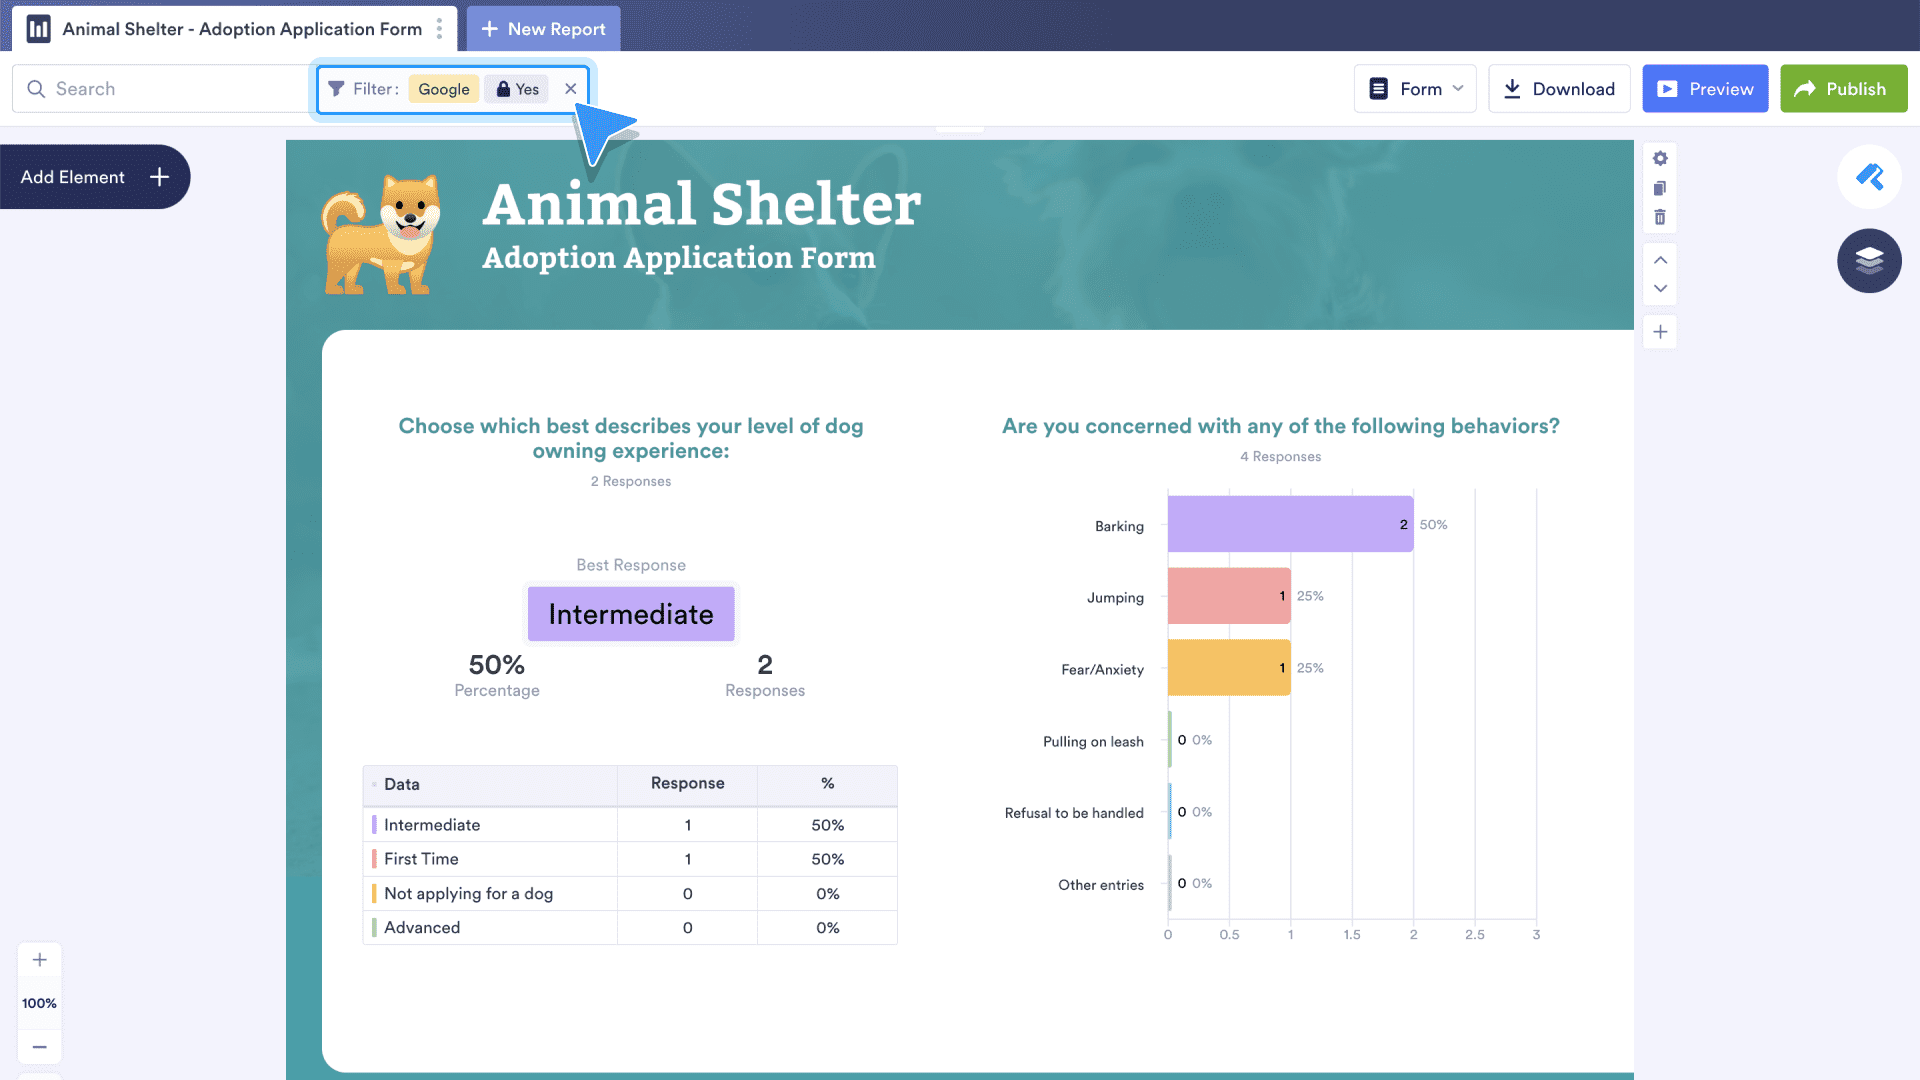
To add more filters, click the Add New Filter link. To lock the filter so the data remains on your screen, click the padlock icon. To clear the filter function, click Clear All Filters, located above the padlock icon.
To clear all filters without opening the filter menu, click the “X” in the filter box at the top of the Report Builder.
Add a report to Jotform Tables
Jotform Tables is Jotform’s spreadsheet-database hybrid tool that’s more dynamic than a conventional spreadsheet. It’s also ideal for collaboration with colleagues. With Jotform Tables, it’s easy to view information in different ways like Calendar and Card views. Plus, it takes just a few seconds to add a report to the mix.
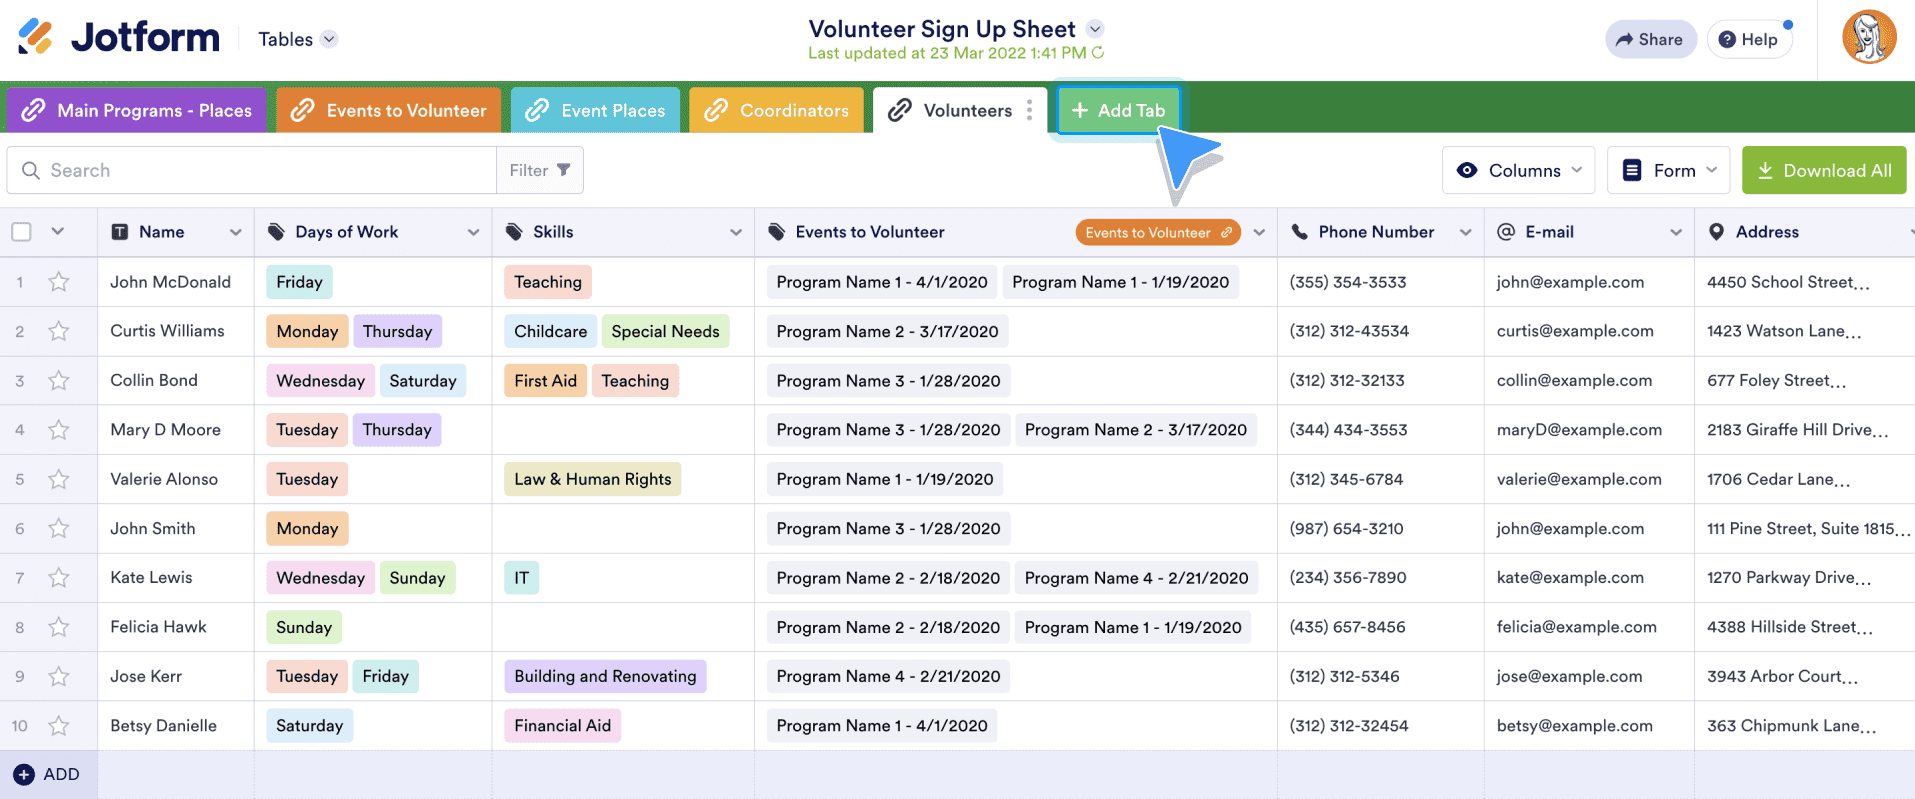
To add a report to your Jotform Tables database, simply add a tab. Click the Add Tab button to get started.
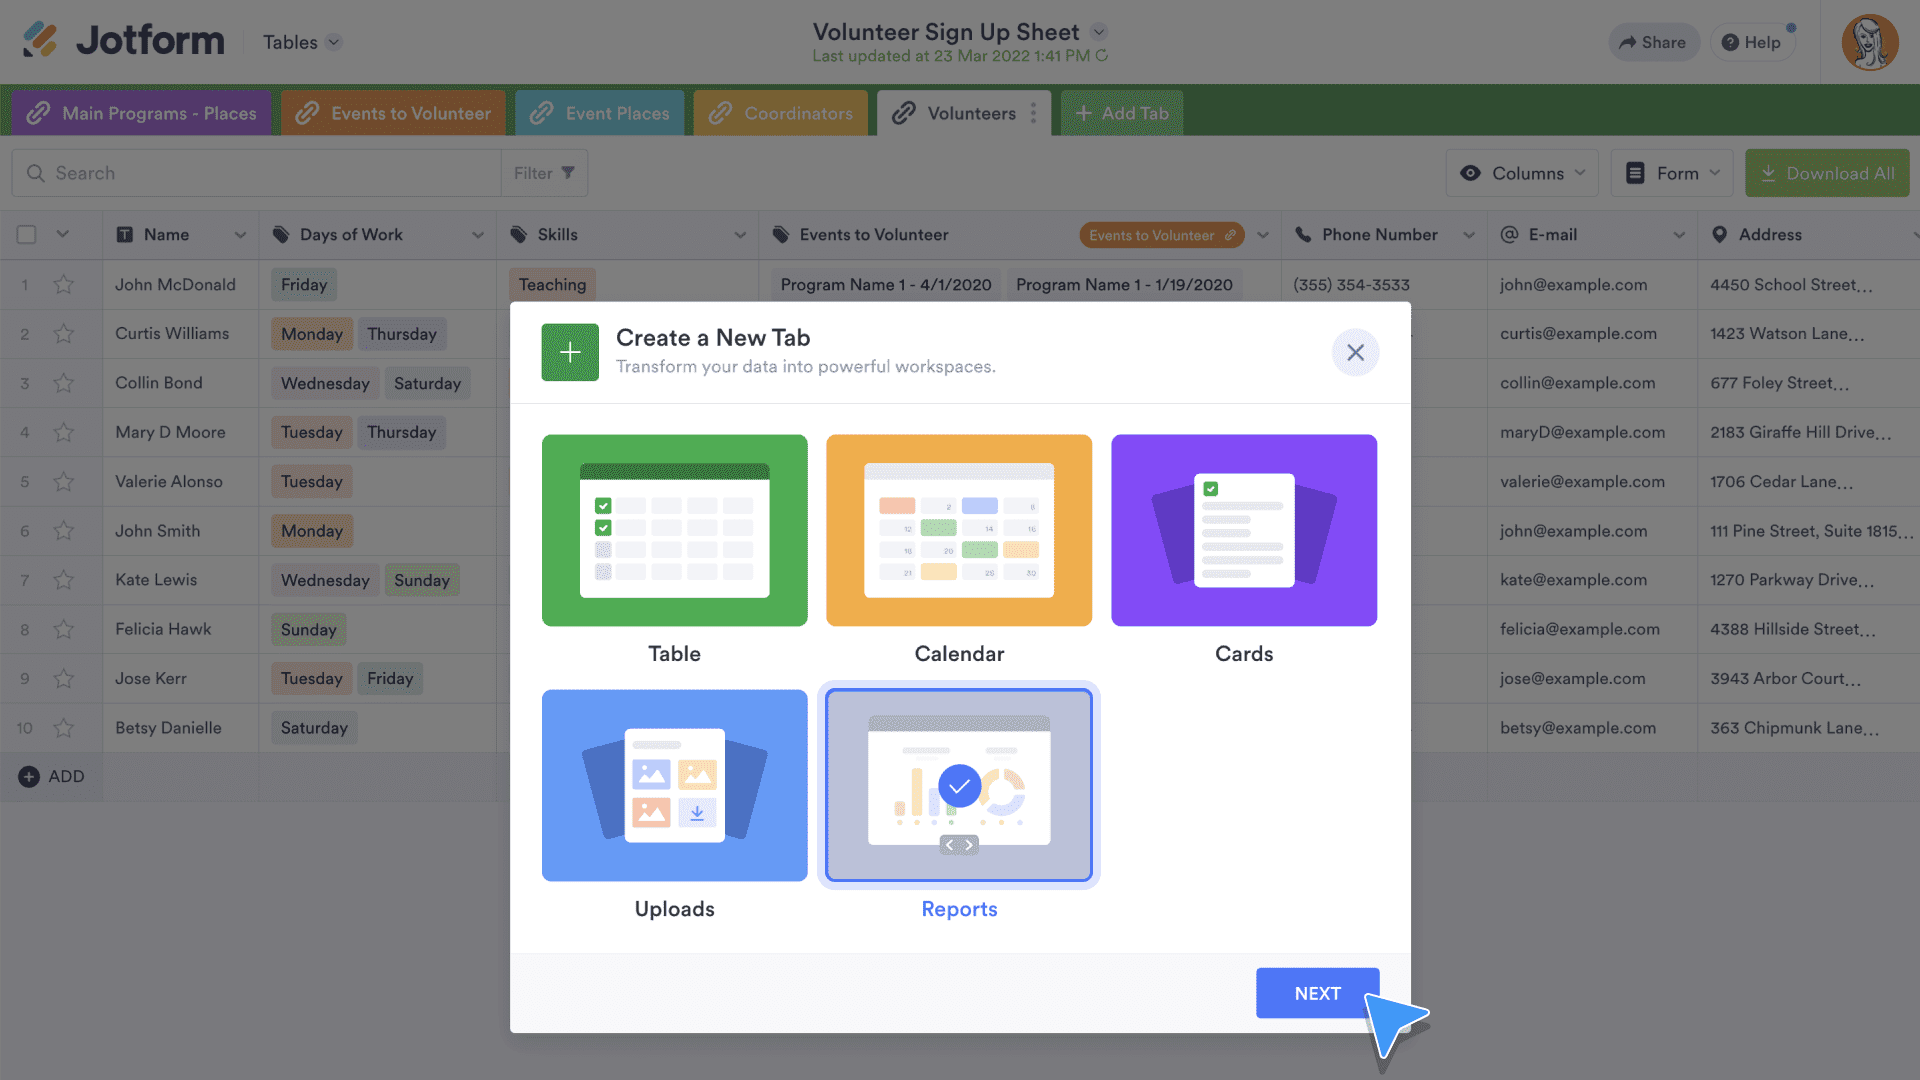
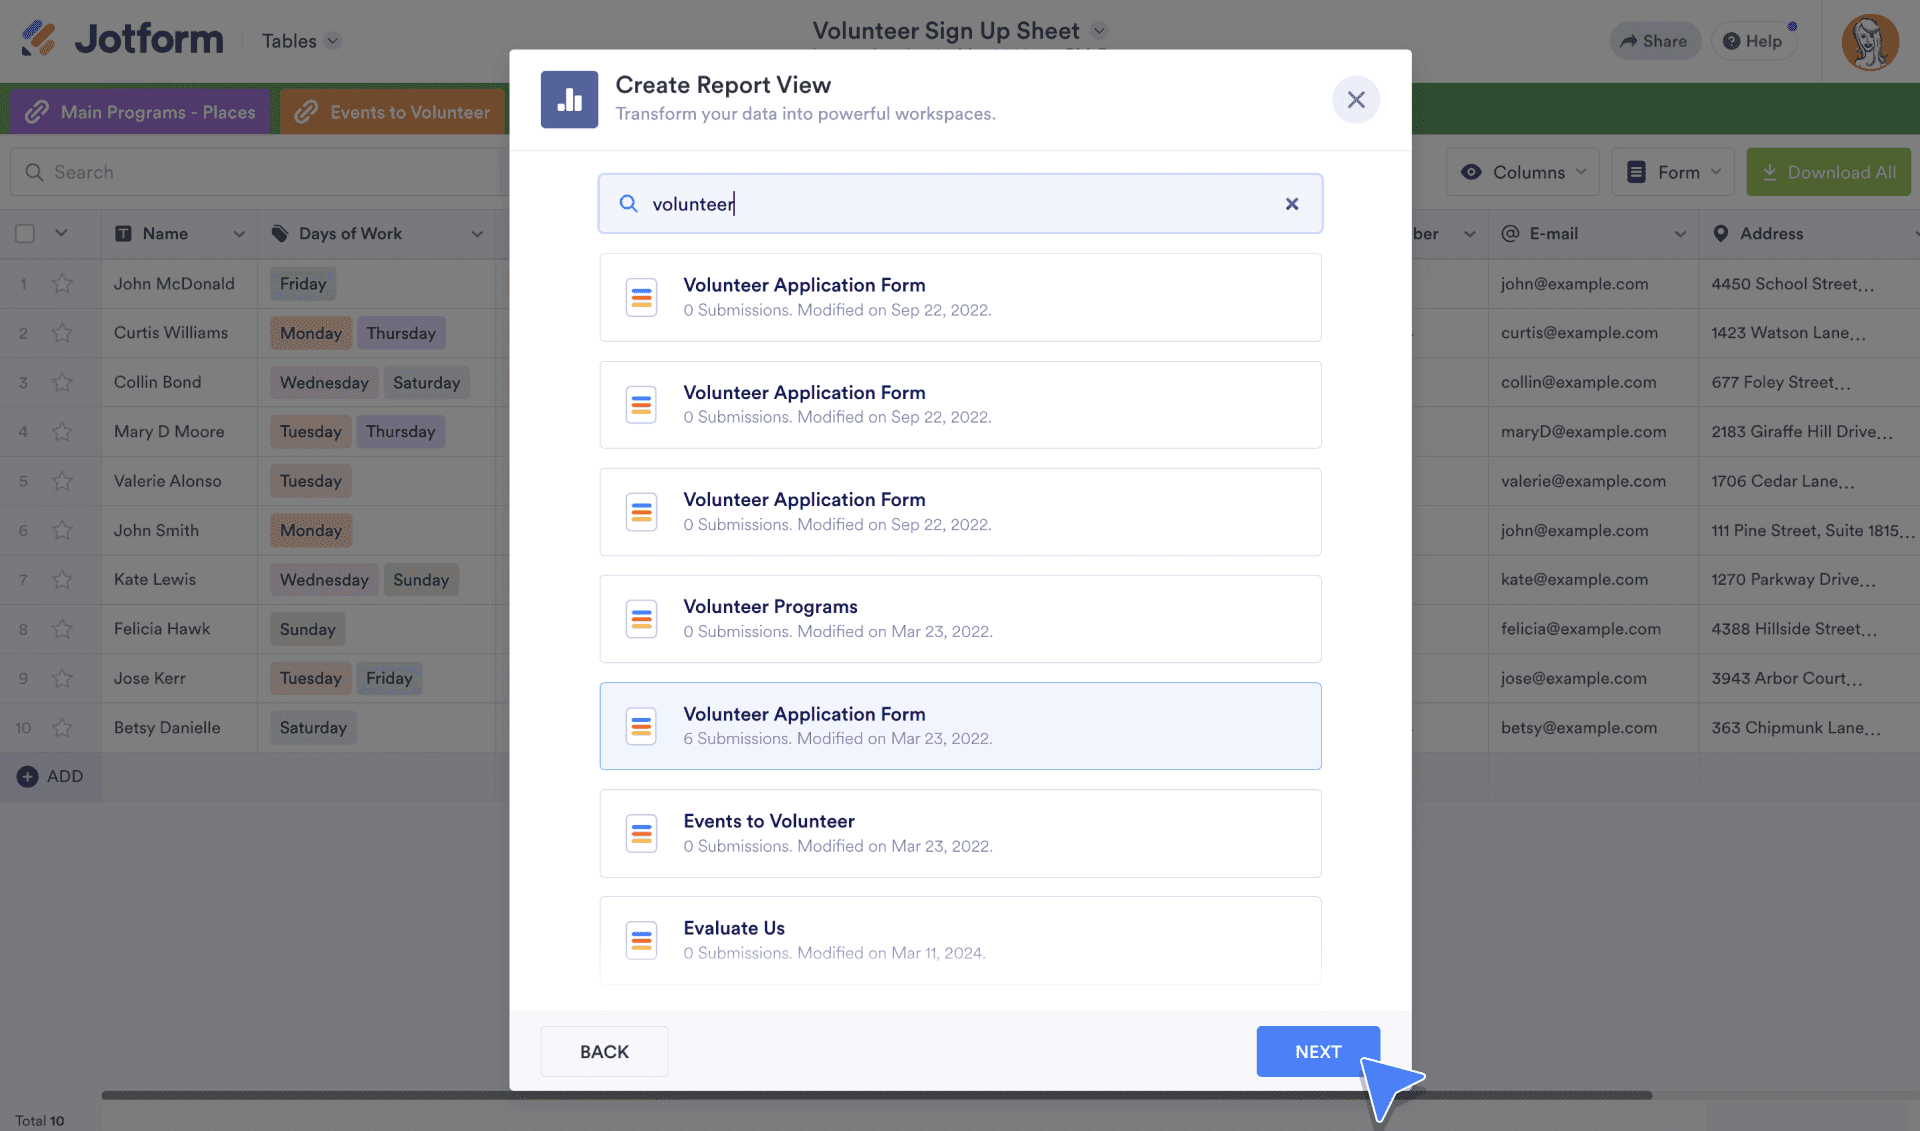
Select the Reports option and then click Next.
Choose which form you’d like to use to create a report. A search bar at the top of the page can help you find any form quickly. Click the Next button to proceed to the next step.
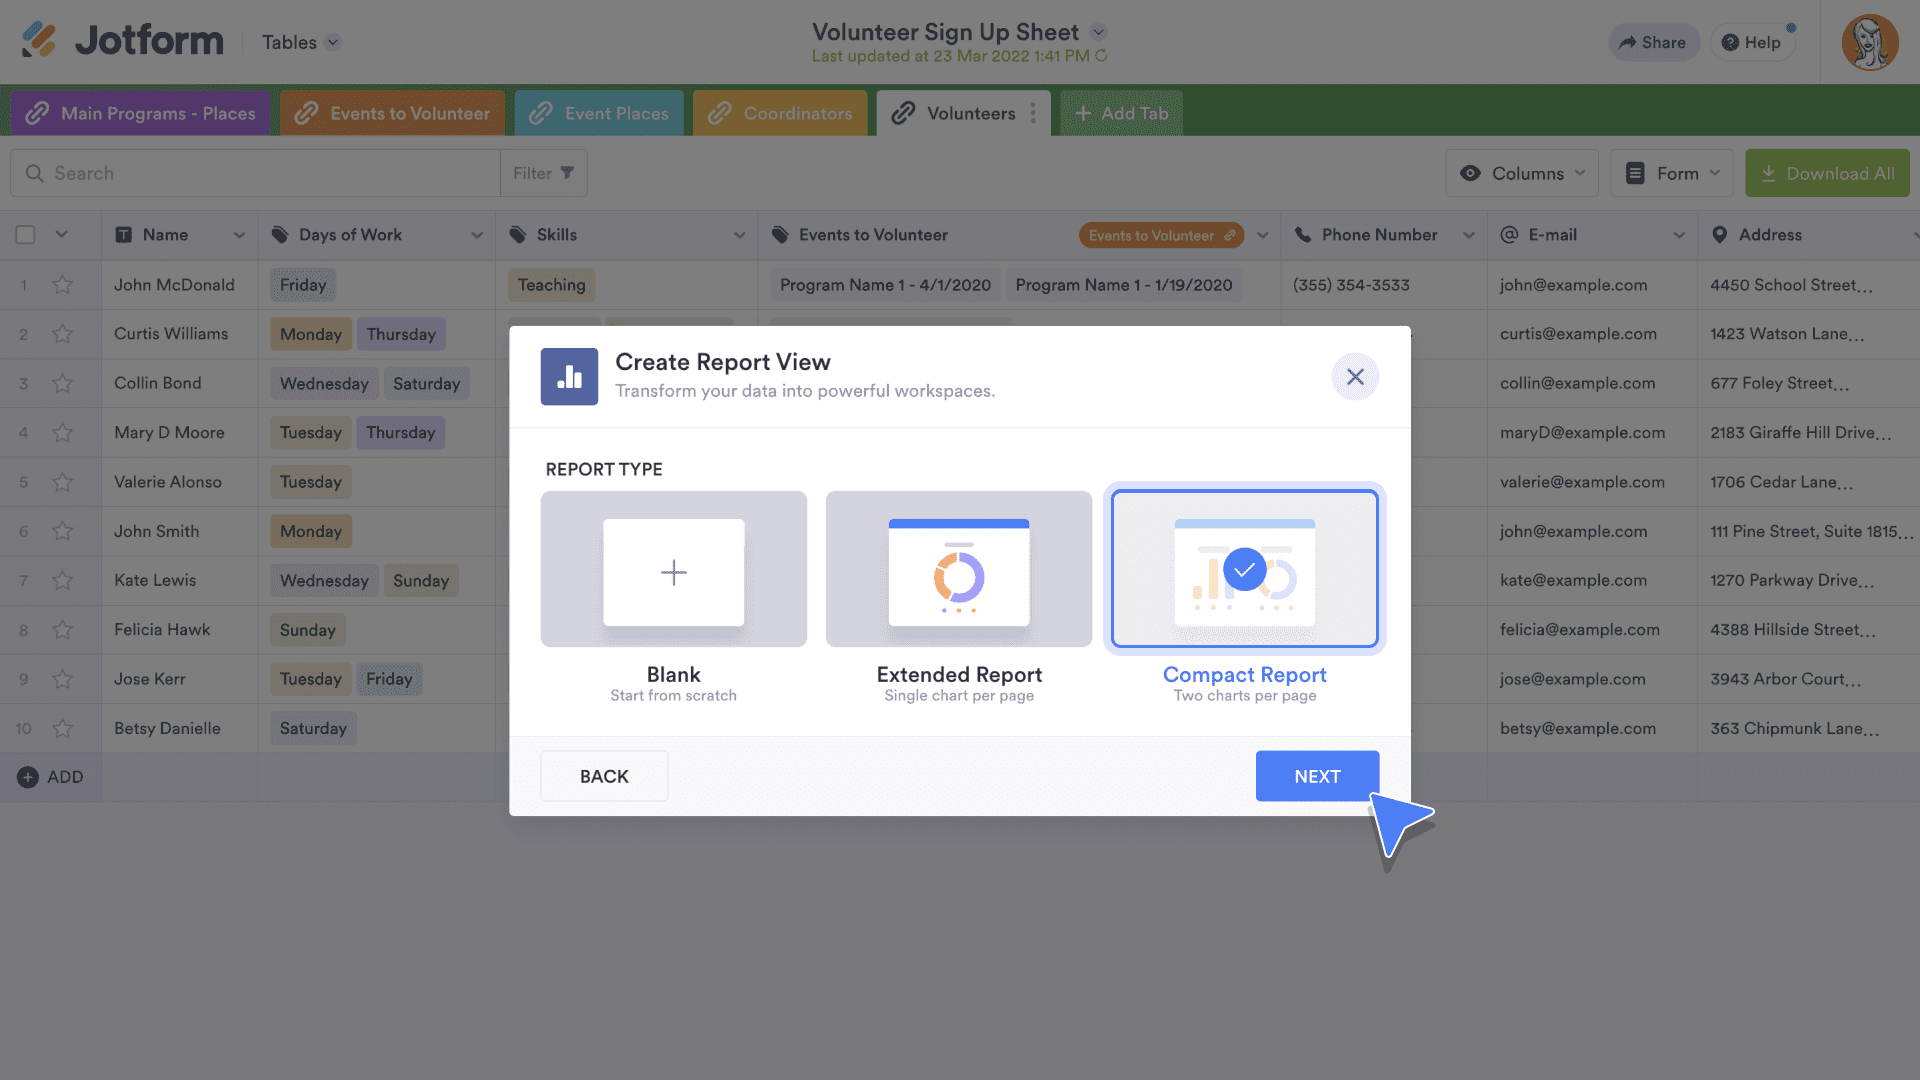
The next step should look familiar by now. Choose from an Extended Report that shows a single chart per page, a Compact Report that displays two charts per page, and a Blank report to customize from the ground up. Note that when you select Blank, all of the Form Elements from the selected form will be available to add to the report via the Add Element button in the Report Builder.
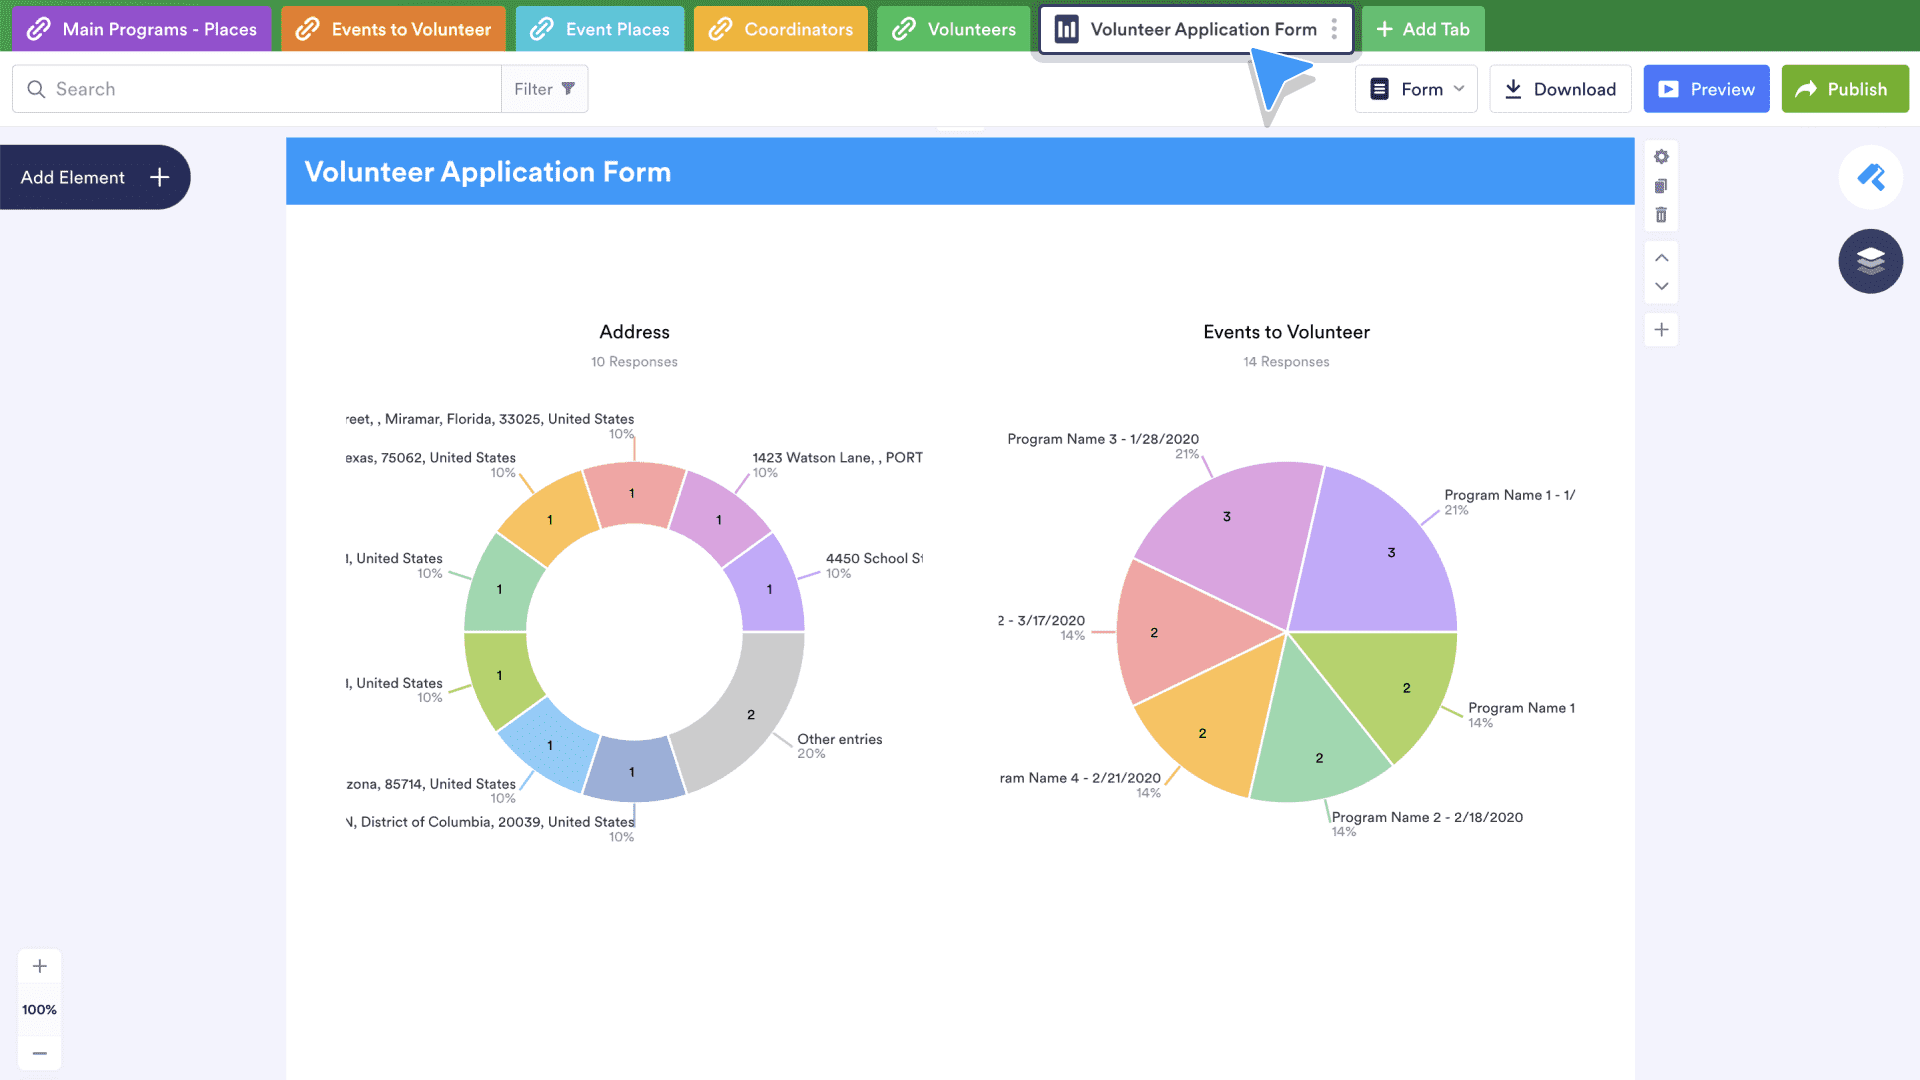
Now your report is viewable from Jotform Tables and has its own tab. Plus, the full functionality of the Report Builder is accessible.
Custom reports for custom needs
Only you know how you want to view and use your data. You may want to show your findings to your team, build a presentation for clients, create a report for partners or the board of directors, or you may simply want to view your data in an easy-to-digest visual format.
That’s why Jotform provides users with seemingly infinite customization options, from how a report appears to how it’s shared. No two datasets are the same, and Report Builder can create a presentation just as unique. Plus, if you’re ever in need of a visual aid and only have minutes to spare, Jotform Report Builder can do the work of a graphic designer in seconds.
Top uses for Jotform Report Builder
As Jotform’s online forms collect submissions, your data is already being organized thanks to automation. Data is instantly sent to Jotform Inbox and Jotform Tables.
And in just a few clicks, Jotform Report Builder builds a presentation-ready report from your data.
While Inbox and Tables provide an easy way to view data and communicate with collaborators and clients, Jotform Report Builder adds extra flair to your data, turning submissions into visually appealing pie charts, bar and line graphs, branded presentations, and more.
Altogether, it’s the ultimate data showcase. But some form types are transformed into reports more often than others.
Top Report Builder uses by form type
The following forms are turned into reports the most, listed in order from the most used to the fifth-most used.
1. Surveys
Many of us want to know what others are thinking. It’s human nature. Unfortunately, that super power doesn’t exist. On the other hand, Jotform has the next best thing with more than 1,000 survey form templates to choose from.
Industries like education, human resources, healthcare, and more depend on Jotform to conduct surveys. Conditional logic makes each survey form easier to complete and submit, as only relevant questions are displayed, based on the form filler’s answers to previous questions.
2. Registration forms
Did you remember to register on time this year?
That question likely brings back memories of event registration. When you host an event of your own, Jotform registration forms can provide an easy way for others to sign up. And the Report Builder can provide a visual representation of attendee information.
Jotform offers 1,000-plus registration form templates, tailored for uses such as school events, sports teams or camps, and contests. As a bonus, add a payment gateway to a registration form so those who register for your event can get everything done at once.
3. Report form
Well, this is certainly no surprise. No. 3 on our list is Jotform report forms.
Expense report forms, incident report forms, and even complaint report forms are some popular options found within the more than 500 report form templates offered by Jotform. Other choices include monthly facility inspection report forms and daily vehicle inspection report forms.
Every form is worthy of being turned into a report, but report forms are especially good candidates as their results are often presented to colleagues or clients.
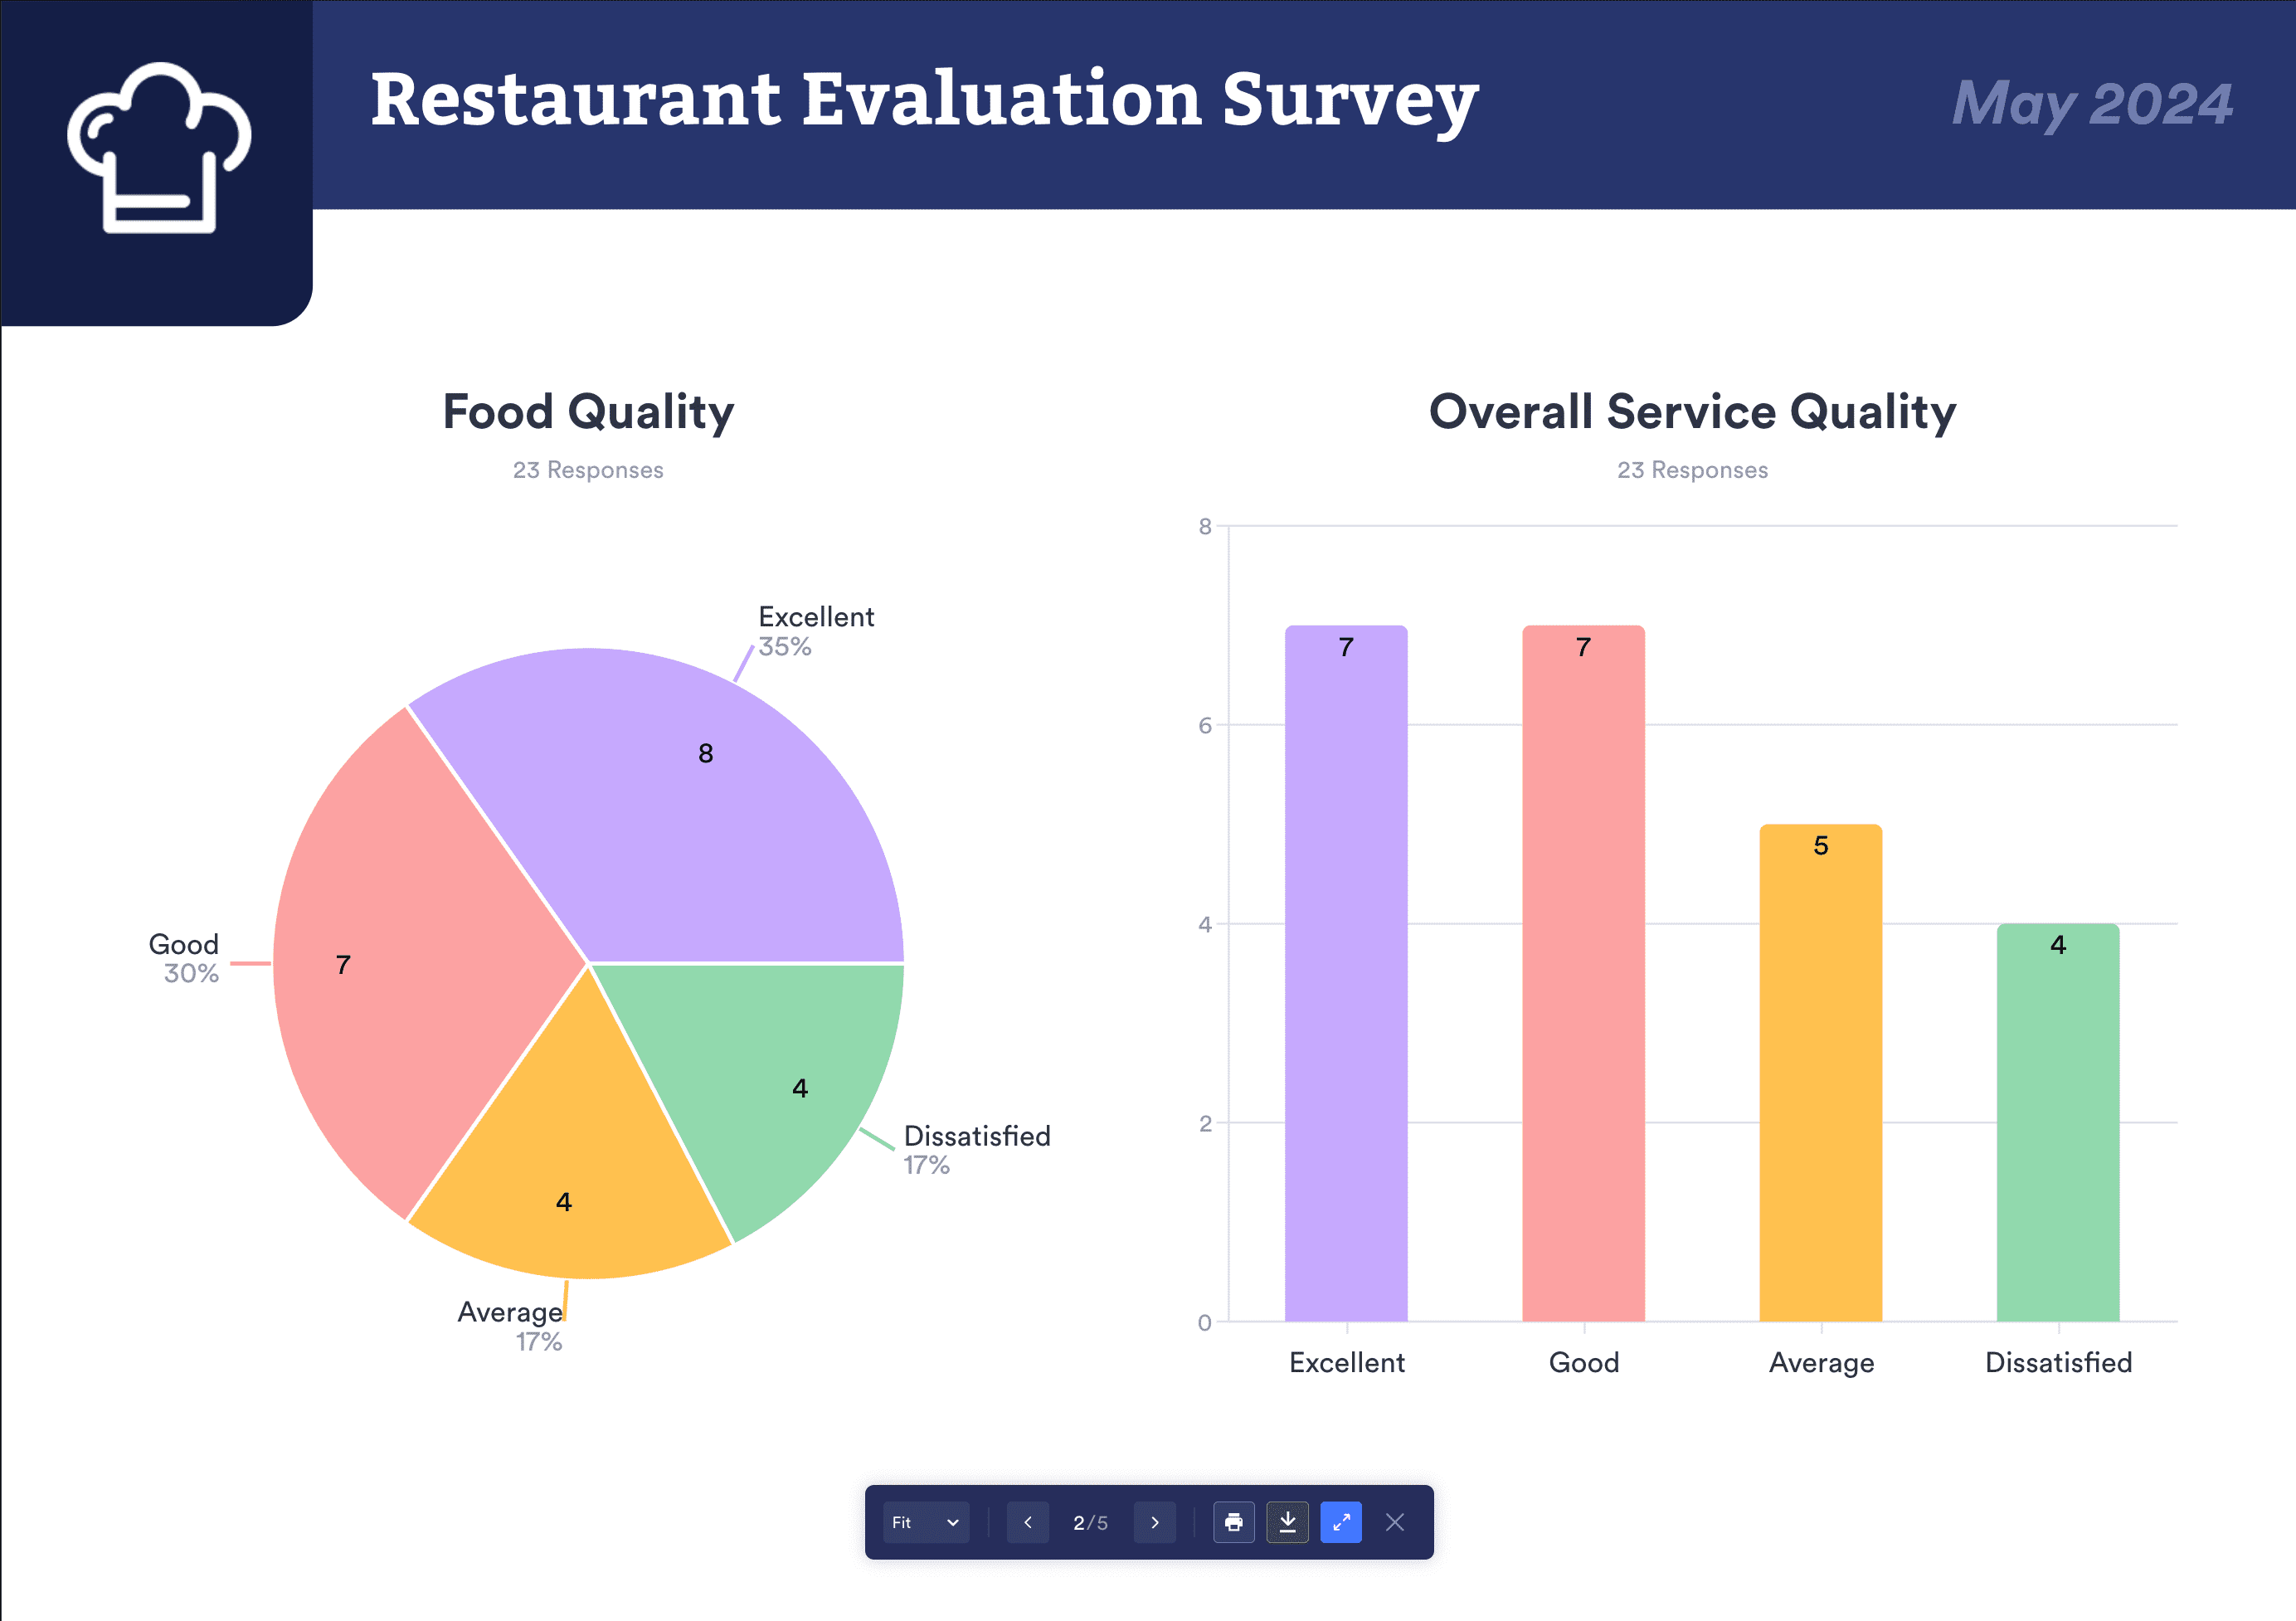
4. Evaluation form
When collecting data to make an evaluation, it’s often best to stand back, take a deep breath, and look at all the data at once.
Jotform users know this. That’s why they turn data collected through evaluation forms into reports with the Report Builder at such a high rate. There are over 600 evaluation form templates to choose from, such as a course evaluation form, a restaurant evaluation form, a training evaluation form, and more. Colorful charts from the Report Builder can help simplify the evaluation process by displaying data in an easily digestible format.
5. Feedback form
A close relative of the survey form and evaluation form, feedback forms are the fifth-most used form type in the Jotform Report Builder.
Forms like event feedback forms, presentation feedback forms, and hotel feedback forms make up the nearly 500 feedback form templates offered by Jotform. Just as with evaluation forms, taking in a lot of feedback at once can be overwhelming without the right automation tools. Many users turn to the Report Builder to boil down their data into easily digestible charts that offer insight into the big picture rather than one submission at a time.
Visual reports and more: Which report types are created the most?
The Jotform Report Builder is most often used to create a visual report, but it can do much more. There are a total of eight different types of reports you can automatically create, including Digest Emails, Calendar Listings, and Grid Listings.
Here’s a visual representation of the report types that are created the most by our users.

Top uses by industry
These rankings reveal which industries turn forms into reports the most. While there is some overlap between this list and the previous one — an evaluation form can be used in nearly every industry, for example — this provides yet more perspective on the top uses for the Report Builder.
1. Education
Every educator loves a good visual aid. That’s why countless students over the years have spent so much time creating presentations for class projects. Creating a report with Jotform Report Builder isn’t a class assignment (at least not from us!), but it’s easy for any student, teacher, or administrator to do.
Incredibly, Jotform offers 2,000-plus education form templates. Collect data with a scholarship application form, a student progress report form, or an array of test and quiz forms. After submissions are tallied, a polished visual report can impress even the most strict of instructors, not to mention peers.
2. Nonprofit
Jotform recognizes the important work nonprofit organizations do. For that reason, Jotform offers a special discount for qualifying nonprofit organizations.
Nonprofits that use Jotform can simplify their donation process with payment forms, manage charity events with registration and guest list tracking forms, and recruit volunteers with a volunteer application form. In just a few clicks, these nonprofit forms can become a report that helps organizations make the best decision possible with their available resources.
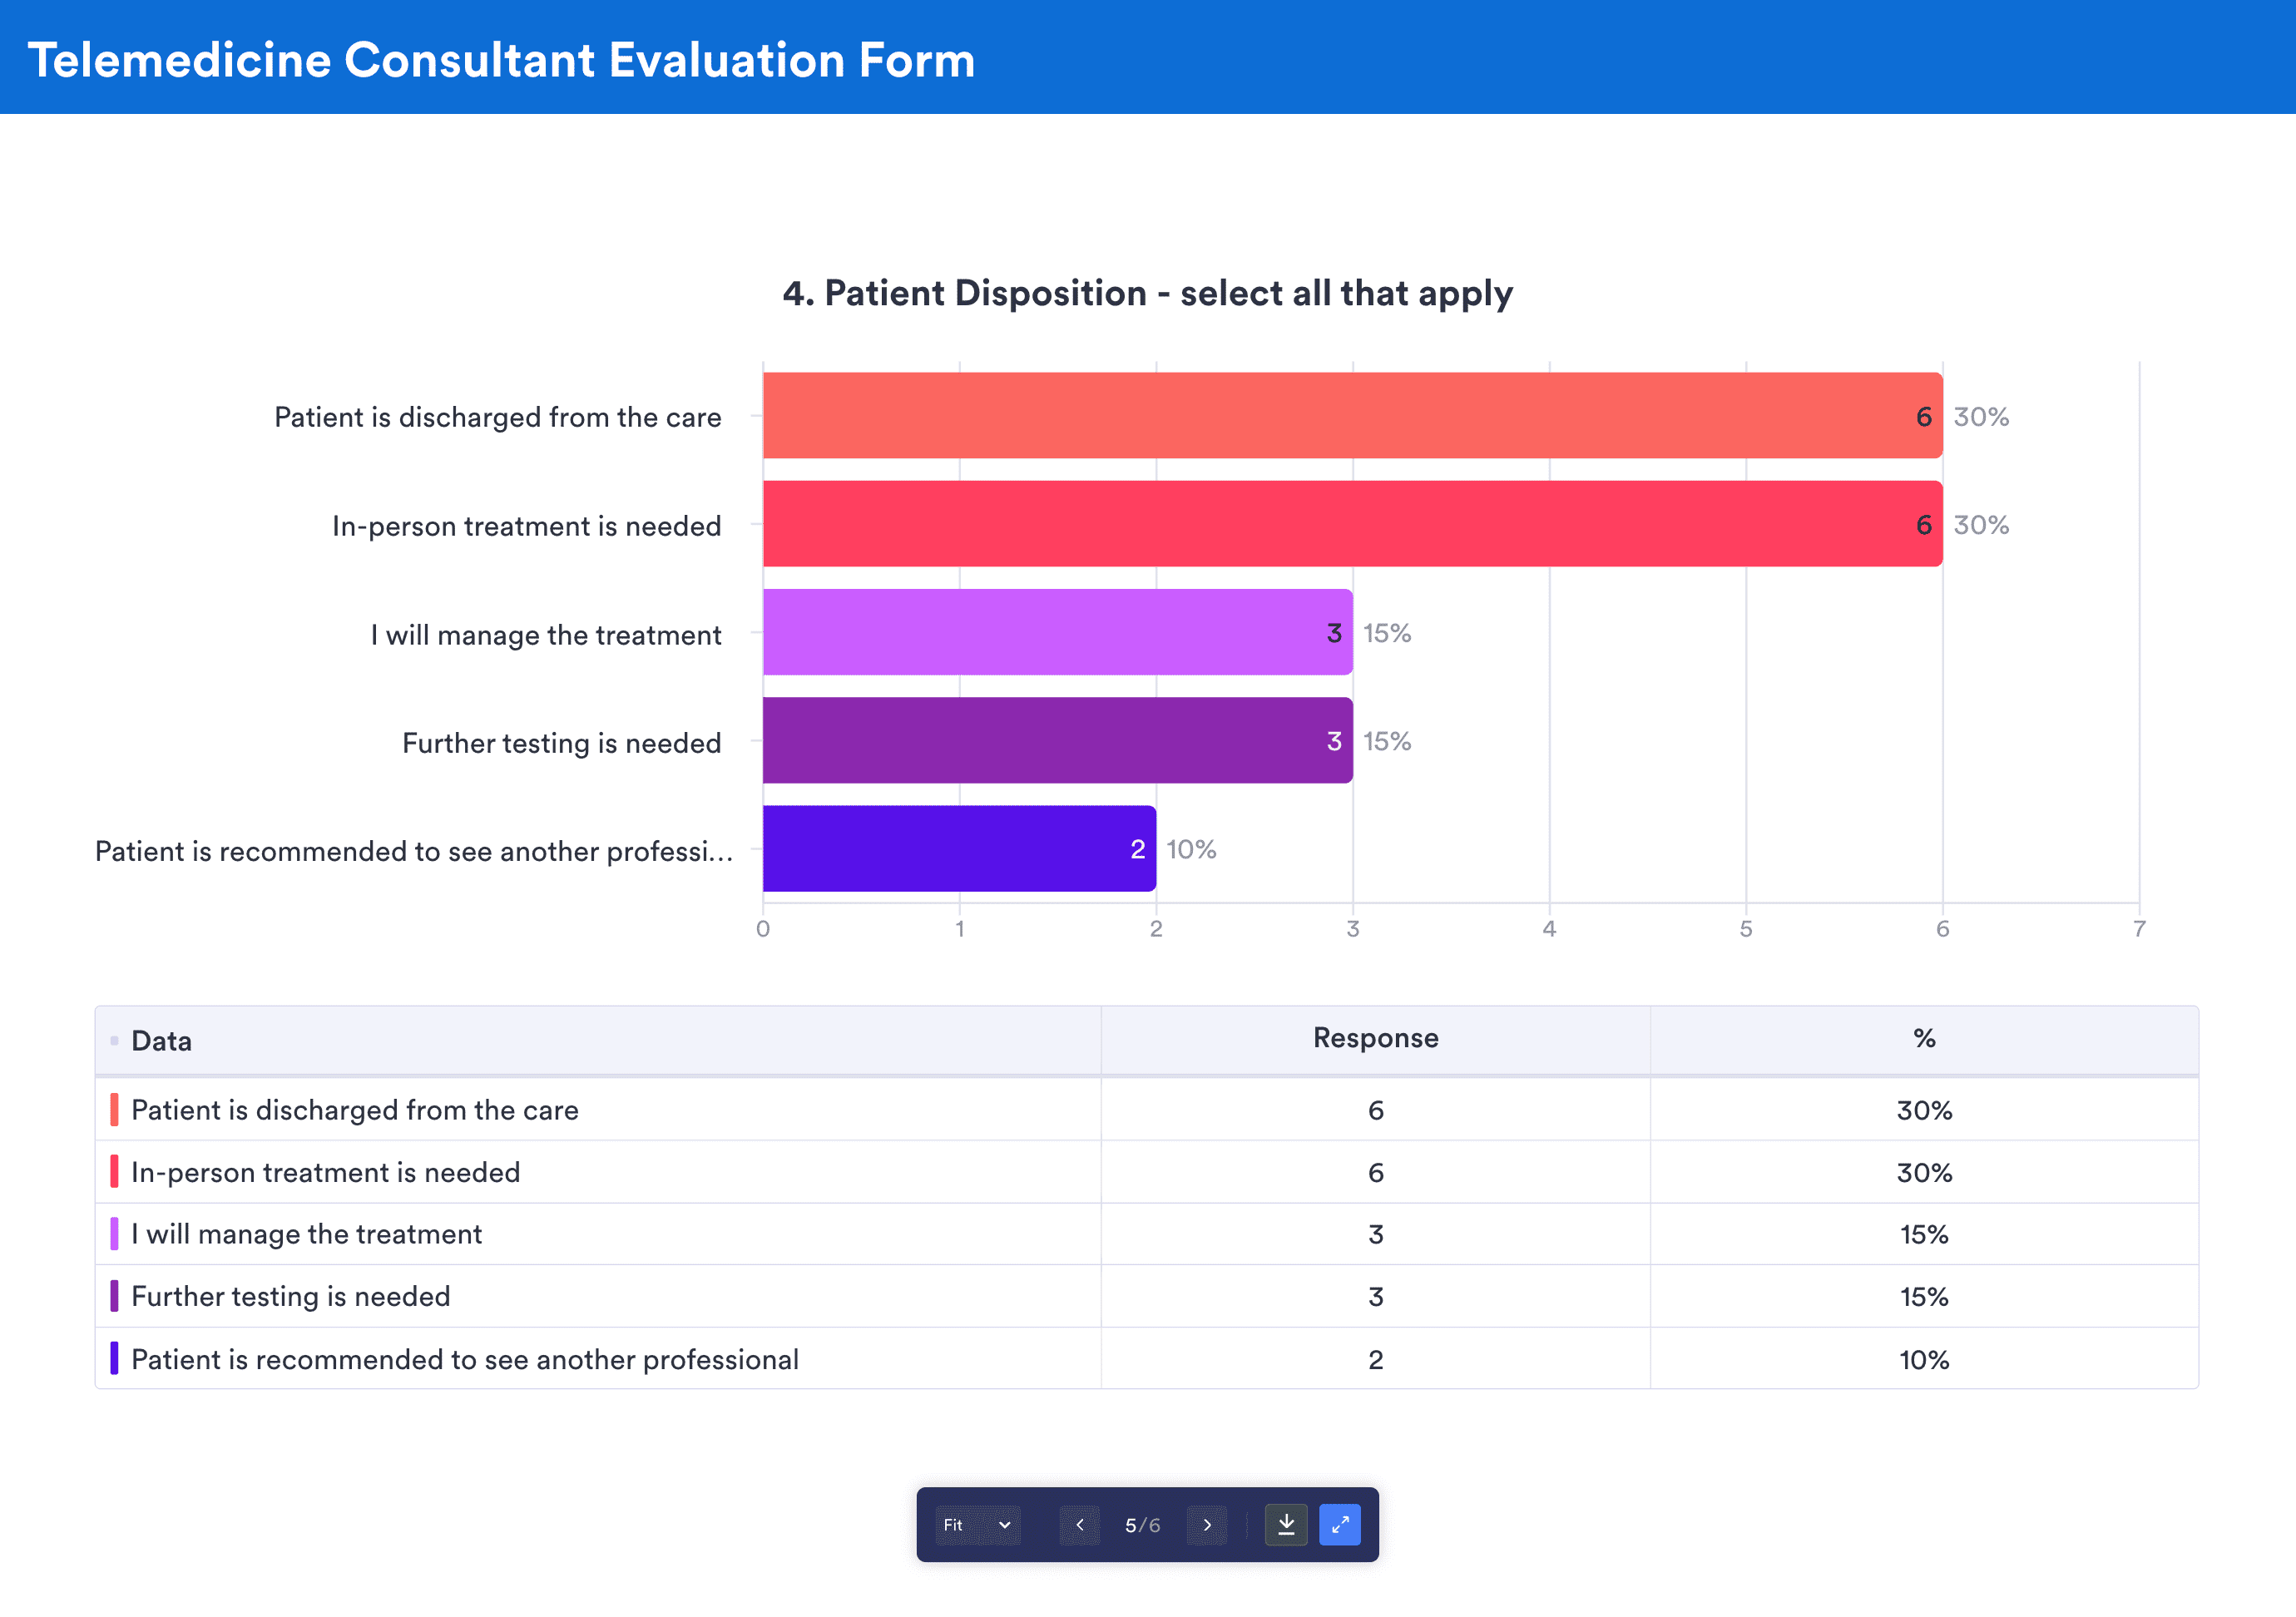
3. Healthcare and social assistance
Jotform offers roughly 2,000 healthcare form templates with a wide variety of uses, such as a medical history form, a hospital discharge form, and telehealth forms. It’s no surprise that this robust industry is No. 3 on our list.
Pharmacy forms, dental consent forms, and student health forms add to the diverse forms available under the healthcare umbrella. Mental health is covered as well, with forms like a social support assistance request form. For institutions that would rather take care of patients than sift through data, the Report Builder can make a real impact.
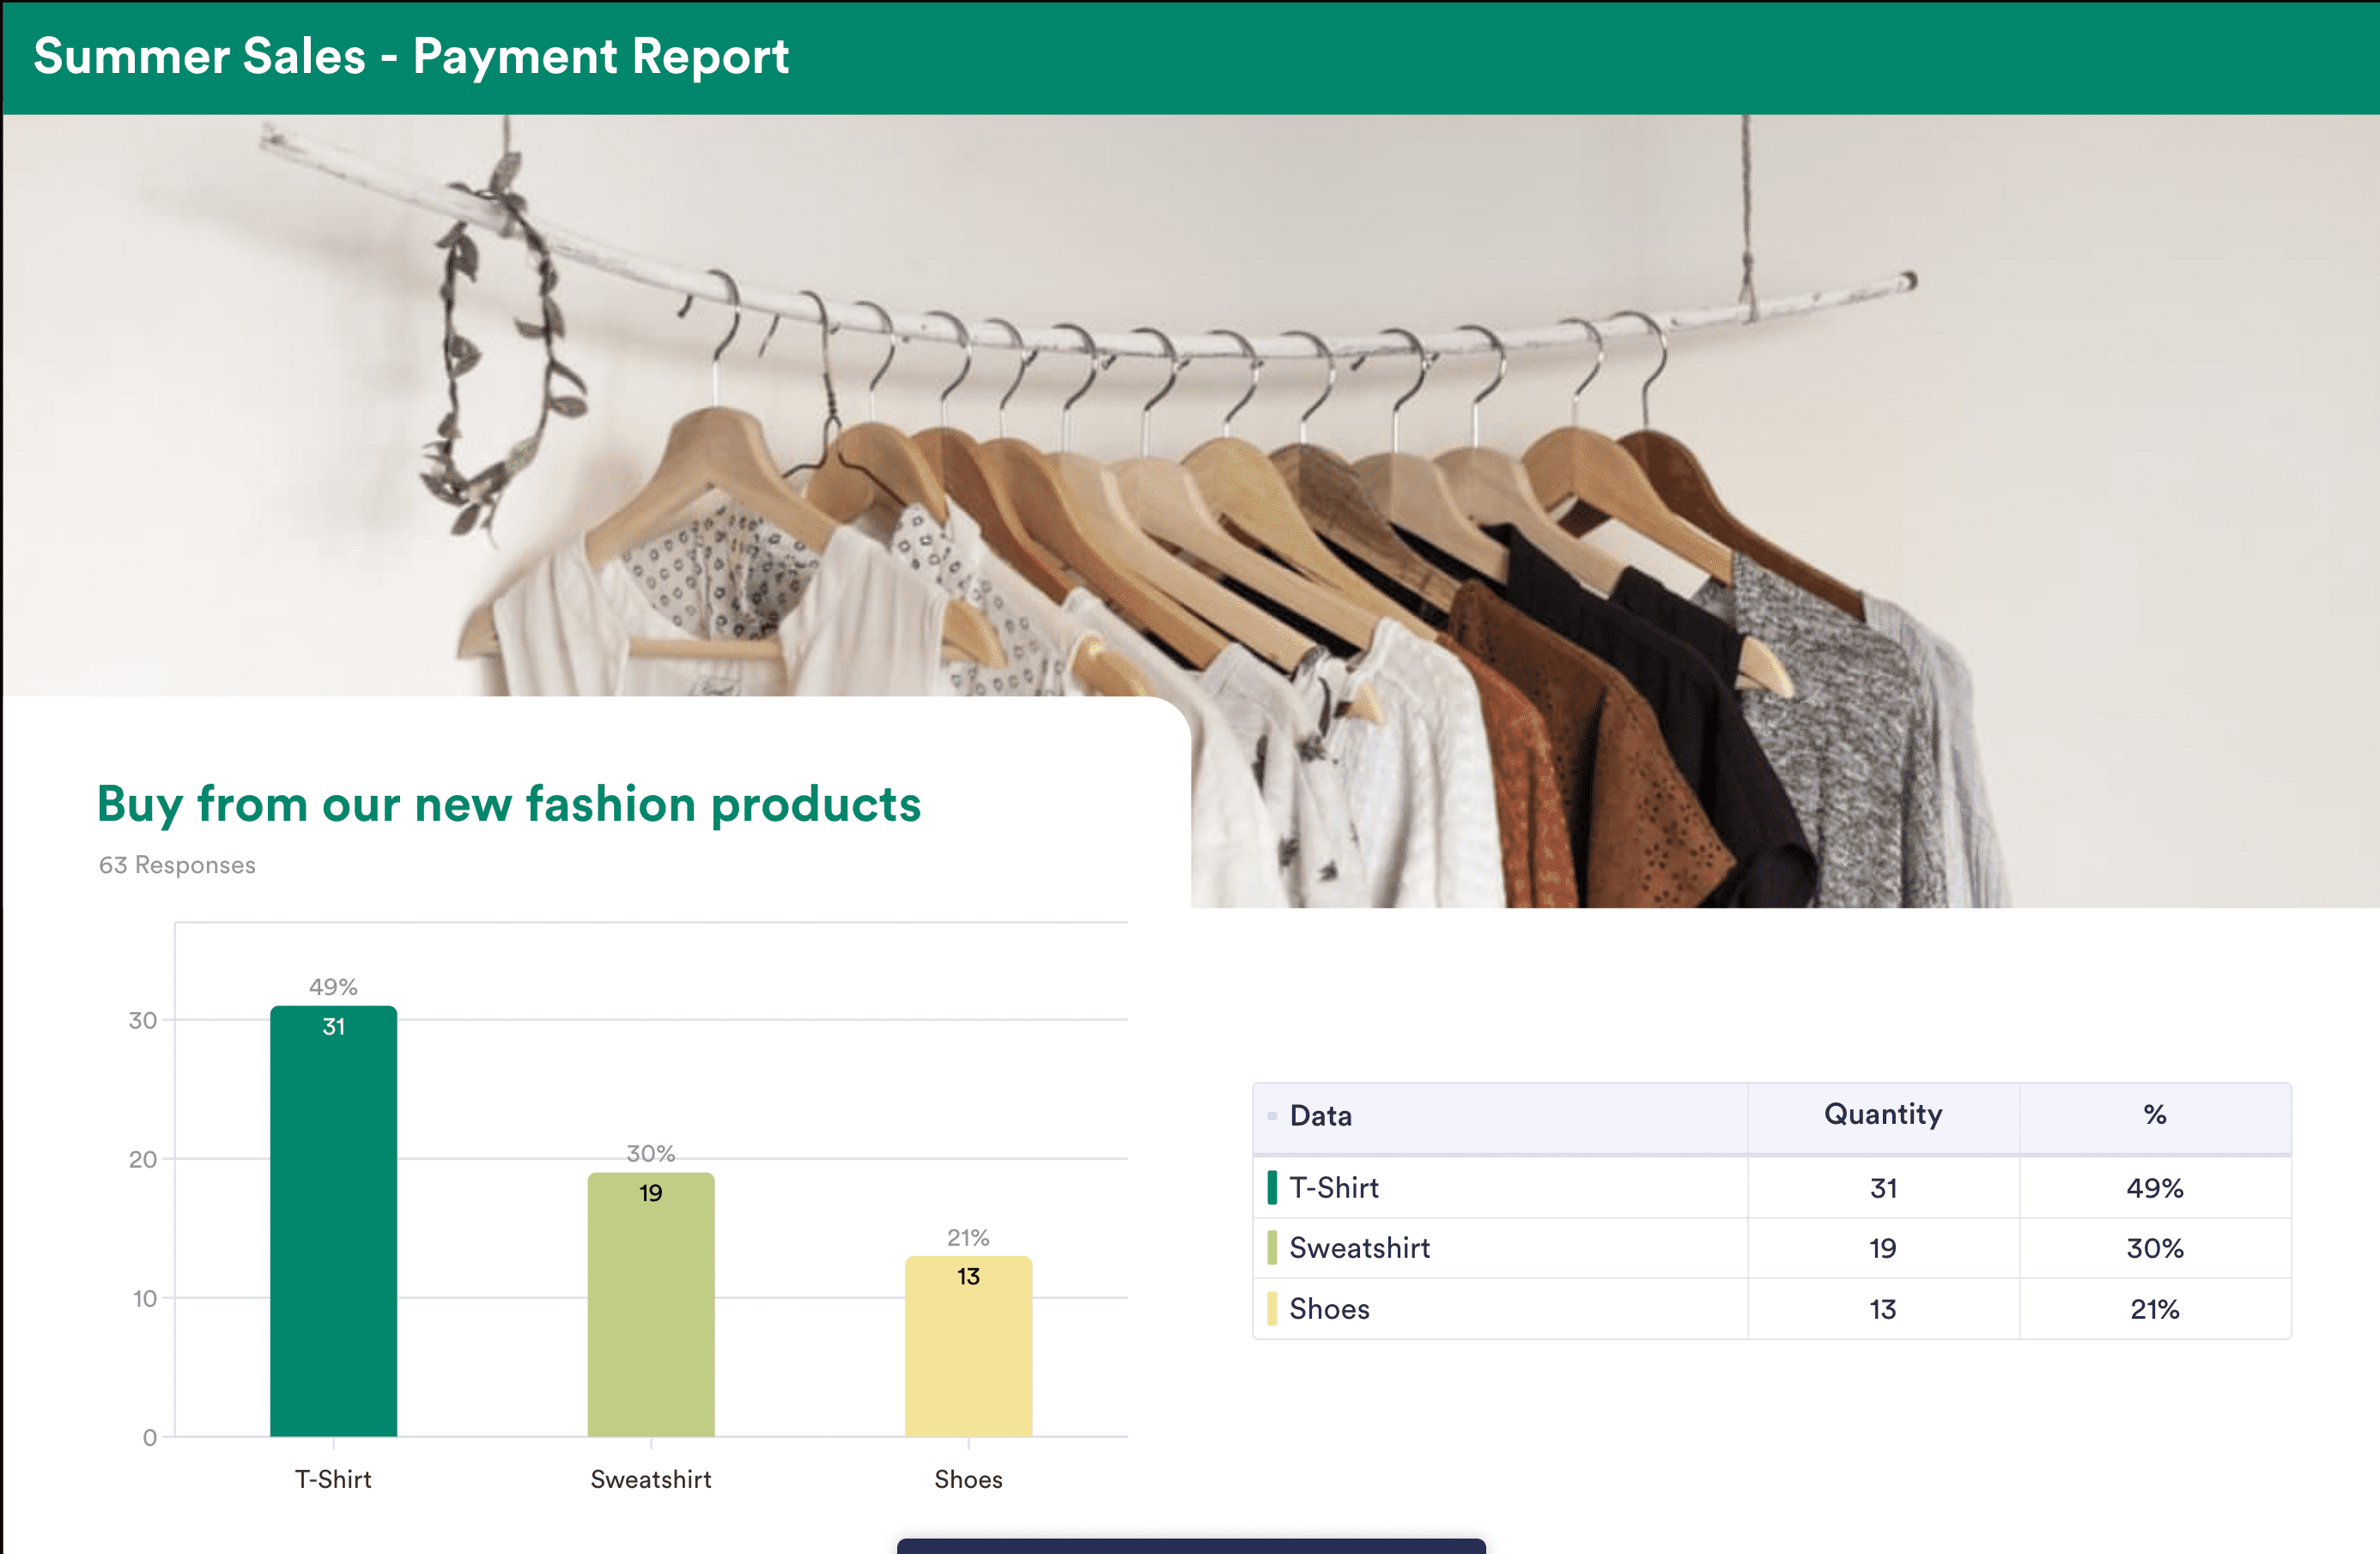
4. E-commerce and retail trade
Jotform is a one-stop e-commerce powerhouse, led by Jotform Store Builder. Add products to your virtual store that look great on any device, even mobile. Each store is powered by order forms and other types of e-commerce forms, such as customer registration forms, Black Friday forms, and purchase order forms.
The Report Builder will turn any of your e-commerce forms into a polished report in seconds. That’s why e-commerce and retail is No. 4 on this list. If creating an entire online store doesn’t fit your exact need, there are plenty of order forms and payment forms that can get the job done on their own, and they’ll look great as reports too.
5. Information technology
While there are “only” about 400 information technology (IT) form templates available from Jotform, this industry checks in at No. 5 on this list. Software survey forms, IT access request forms, and an IT satisfaction survey are just a few examples of popular uses for forms and the Report Builder.
Now let’s take a look at how one organization uses Jotform Report Builder.
How the Santa Barbara Zoo named its new baby giraffe with Jotform
The Santa Barbara Zoo uses Jotform for a host of internal and customer-facing tasks, from marketing support requests to its Zoo Camp waitlist.
So when the zoo welcomed a special new addition — a baby giraffe — the organization turned to Jotform for help.
The zoo asked its fans to decide on the perfect name and fielded opinions via an online form. After nearly 2,000 votes produced a winner, the Santa Barbara Zoo used Jotform Report Builder to create a visual report of the results for the zoo’s board of directors.
The data showed a close race between two name choices that are meaningful to the zoo staff. In the end, Malia won out.

Wendy Campbell, creative brand manager at the Santa Barbara Zoo, says creating a visual report with Jotform Report Builder took less than a minute, which saved valuable time.

Case study results at a glance
| Fielded nearly 2,000 votes to name the new giraffe via an online form | Used Jotform Report Builder for presentation to zoo board | Transfers Jotform data to Trello |
|---|---|---|
| Zoo donors decided the public should vote on two names. | Jotform Report Builder created a visual aid fit for the boardroom in seconds. | Submission data is automatically sent to the zoo’s Trello boards, saving time every day. |
Two meaningful name choices, one close vote
Campbell has been with the zoo since 2000 and started using Jotform in 2012. “It’s just generally time saving to me because it’s so easy to use,” she says.
Before Campbell created her voting form with Jotform, a lot of thought went into the two potential names.
Those who support the zoo with donations and animal sponsorships often name the zoo’s new arrivals. This is especially the case for popular animals, and giraffes certainly qualify. (In fact, 13 Masai giraffes have been born at the zoo since 2012.) In this case, zoo donors wanted the zoo staff and the greater public to decide on a name.
The original idea was for the donors, the animal keeper staff, and the remaining zoo staff to each come up with a name to be voted on. When the donors saw the two names the zoo staff selected, they loved both and said a third choice wasn’t needed.
“This was really like a gift back to the zoo staff,” Campbell says.
The winning name — Malia — is a combination of the names Michael and Adia, Malia’s parents. The other choice, Indira, was nominated in honor of a docent who has volunteered at the zoo for more than 20 years.

The final tally was close, with Malia earning 57 percent of the vote.
“It was a really tough call because they’re both incredibly meaningful,” Campbell says.
There is yet more meaning behind the winning name. Malia’s father Michael died shortly after Maila was born. Michael fathered 12 calves over the years, and his memory will carry on through his last offspring at the zoo. Also, the name Malia means “the queen” in Swahili.
Even as a queen, Malia shares the spotlight at the zoo with fellow giraffes Audrey, Theo, her mother Adia, and her brother Raymie.
Masai giraffes: An endangered species thrives at the Santa Barbara Zoo
The giraffes at the Santa Barbara Zoo are Masai giraffes. Masai giraffes are the largest giraffe subspecies, growing up to 17 feet tall and weighing as much as 2,700 pounds. These giraffes are also endangered, as their population has fallen by nearly 50 percent in the last three decades.
The Santa Barbara Zoo works closely with fellow Association of Zoos and Aquariums (AZA) accredited zoos to revive Masai giraffe populations, often sending giraffe calves to other accredited zoos. Overall, 123 Masai giraffes live at 32 accredited zoos in North America.
Jotform Report Builder in the boardroom
Naming baby Malia was a big deal for zoo-goers, but the vote was important to zoo stakeholders as well. After voting was complete, the zoo’s marketing director prepared a report for display at a board of directors meeting.
The report took less than a minute to create with Jotform Report Builder. In just a few clicks, Campbell’s submission data was transformed into a visual aid fit for the boardroom.
“The director of marketing used the pie chart in materials he gave to his boss, who actually did the reporting in the meeting,” Campbell explains.
Though the pie chart was polished enough to show to the board, creating it took minimal effort.
“It literally took me under a minute to create the report,” Campbell says. “It was super, super easy, and I hadn’t used it before in terms of making a graph or a visual representation. It was a nice surprise, how easy it was to do.”
Campbell also shared the report via email in the zoo staff’s weekly memo. Anytime the board of directors asks for a visual representation of data, Campbell and her team can get the job done in no time.
“I really like being able to just pop in there and pull out a chart. It’s so easy.”
Time saved with Jotform and Trello
Campbell saves additional time by automatically sending Jotform submission data to her preferred project management tool, Trello. The workflow has cleaned up a process that was previously too messy to be productive.
“It was a little sloppy before we started using the form,” she said. “We set up Zapier so our forms go directly into Trello. All of the data goes into a specific column.”
That helps Campbell get more done with limited resources. Workflows with Jotform integrations can provide any organization with an edge, but for a nonprofit organization, saving time is vital.

Photos courtesy of the Santa Barbara Zoo
“We’re a little bit scrappy, being a nonprofit. We all just try to get our job done in the most effective way possible.”
The majority of the Santa Barbara Zoo’s forms are connected to Trello. There are forms for marketing requests, including social media content, business card requests, the Zoo Camp waitlist, and more.
Campbell and her staff have saved more time by adding conditional logic to the zoo’s preschool signup form. What’s more, Campbell embeds a variety of forms into the zoo website and takes advantage of the real-time updates as she edits forms in the Form Builder.
How a small nonprofit team gets more done
Campbell had never added conditional logic to an online form before. When she thought conditional logic was needed for the zoo’s preschool program signup form, she dove right in and realized how straightforward and intuitive the process is.
“Conditional formatting seemed complicated because we hadn’t done anything like that,” she says. “But it was really easy to find out how to do it and how to fix it if it wasn’t working how I thought it was.
“The usability is really good for someone who’s not doing that type of work all the time. That’s another plus for me.”
The zoo’s preschool program has different levels of membership: either two days a week, three days, or five. Campbell’s form displayed relevant options based on the respondent’s initial information, making the form much easier to complete and submit.
On the back end, Campbell raves about how her embedded forms update automatically.
“I’m always really grateful when I’m reminded that [real-time changes] are going on because we have a lot of forms embedded in our website. It’s so nice to know that I don’t have to go back to our website and update anything that’s been changed.
“I’m constantly reminded about what a nice feature that is: to have that update in real time. It couldn’t be more user friendly. Everything’s very intuitive.”
Bringing joy to fans of the Santa Barbara Zoo
Campbell and her team use Jotform because it helps them get more done. But for them, it’s most important to keep fans of the Santa Barbara Zoo engaged, informed, and entertained. Jotform’s online forms keep the lines of communication between zoo patrons and zoo staff open, leading to positive outcomes for all who care about the Santa Barbara Zoo and the special animal friends there.
“I always will err on customer usability,” Campbell said. “If the back end has to suffer, I will take that. But I don’t feel like that about Jotform. It’s just as easy on both sides, which is very important.
“And I like the fact that if I ever decide to leave after being here so long, I don’t think it would be hard for someone to jump in and figure it out.”
For now, Campbell doesn’t plan on leaving the zoo anytime soon, especially as baby Malia begins her journey among her giraffe family and a community and staff that care so much about the Santa Barbara Zoo.