words ~ min read
Understanding your form conversions with Form Analytics
By now you’ve seen how Jotform’s automation suite empowers you to organize and manage data in Jotform Tables, view and operationalize information in Inbox, and create cool data visualizations and reports through the Report Builder.
That alone is a pretty powerful workflow solution.
But your data automatically populates another interface within the Jotform ecosystem that enables you to
- Holistically analyze your form data
- Improve your responses
- Understand and learn from your customers’ behavior
We get it; you’re busy. Every day. Same here.
However, if you take the time to analyze your data every so often, we promise you’ll gain insights that will help you understand your form submitters a little better.
In turn, you’ll be empowered to make improvements that raise your response conversion rates and help you collect the information you really need. Ultimately that’s the goal, right?
The folks at Qualtrics report that a typical form response (or conversion) rate is usually between 20 and 30 percent. If you’re seeing lower rates for your forms and/or surveys, it’s time to take action.
Start analyzing your Jotform submissions
The good news is that an analytics dashboard for your forms isn’t an add-on or a condition of your Jotform service level. It’s available to everyone, free of charge, and accessible from your My Forms page.
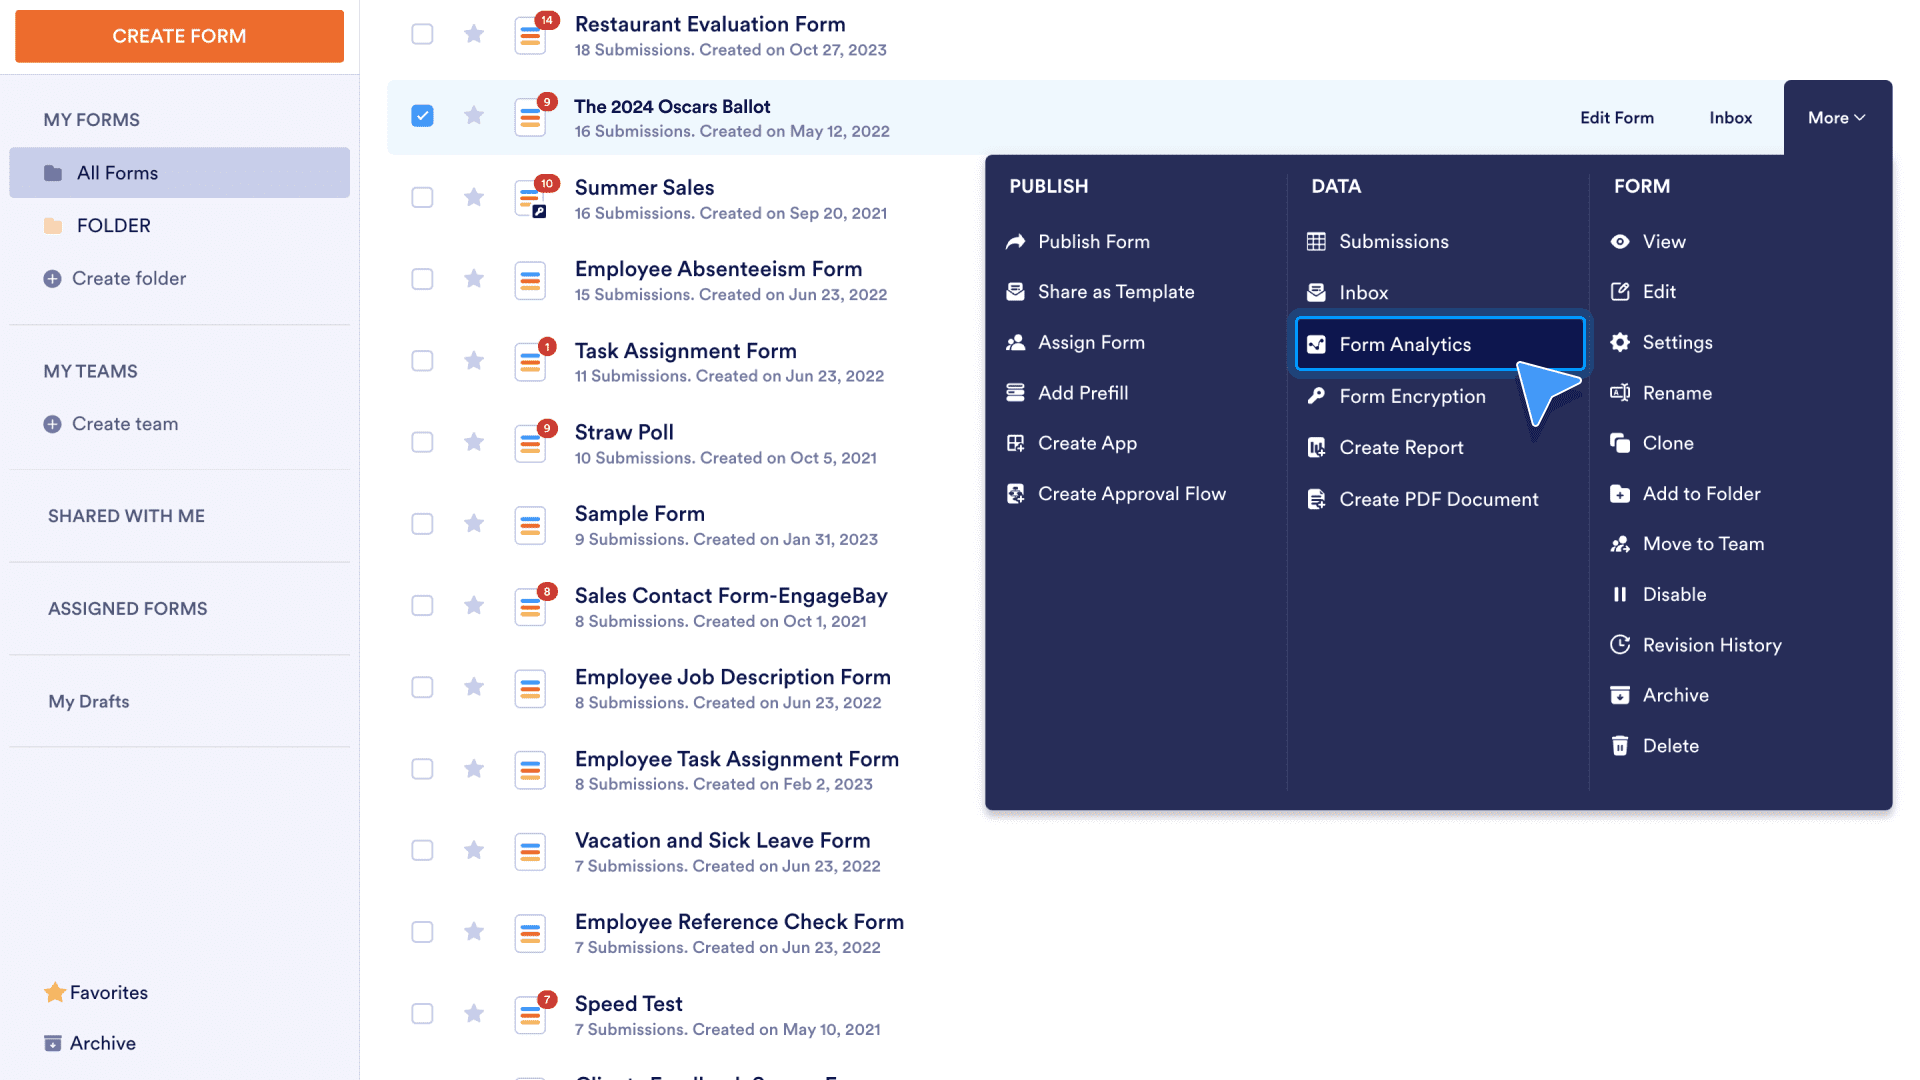
Select the form you’d like to view stats for and click on the More button on the far right. Then select Form Analytics in the Data column.
On the analytics screen you’ll see a helpful overview of submission activity that includes overall form views, the number of form responses, the conversion/response rate, and the average time to fill out the form.
You can sort your submission data by the current week or month, a custom date range, or view it for all time.
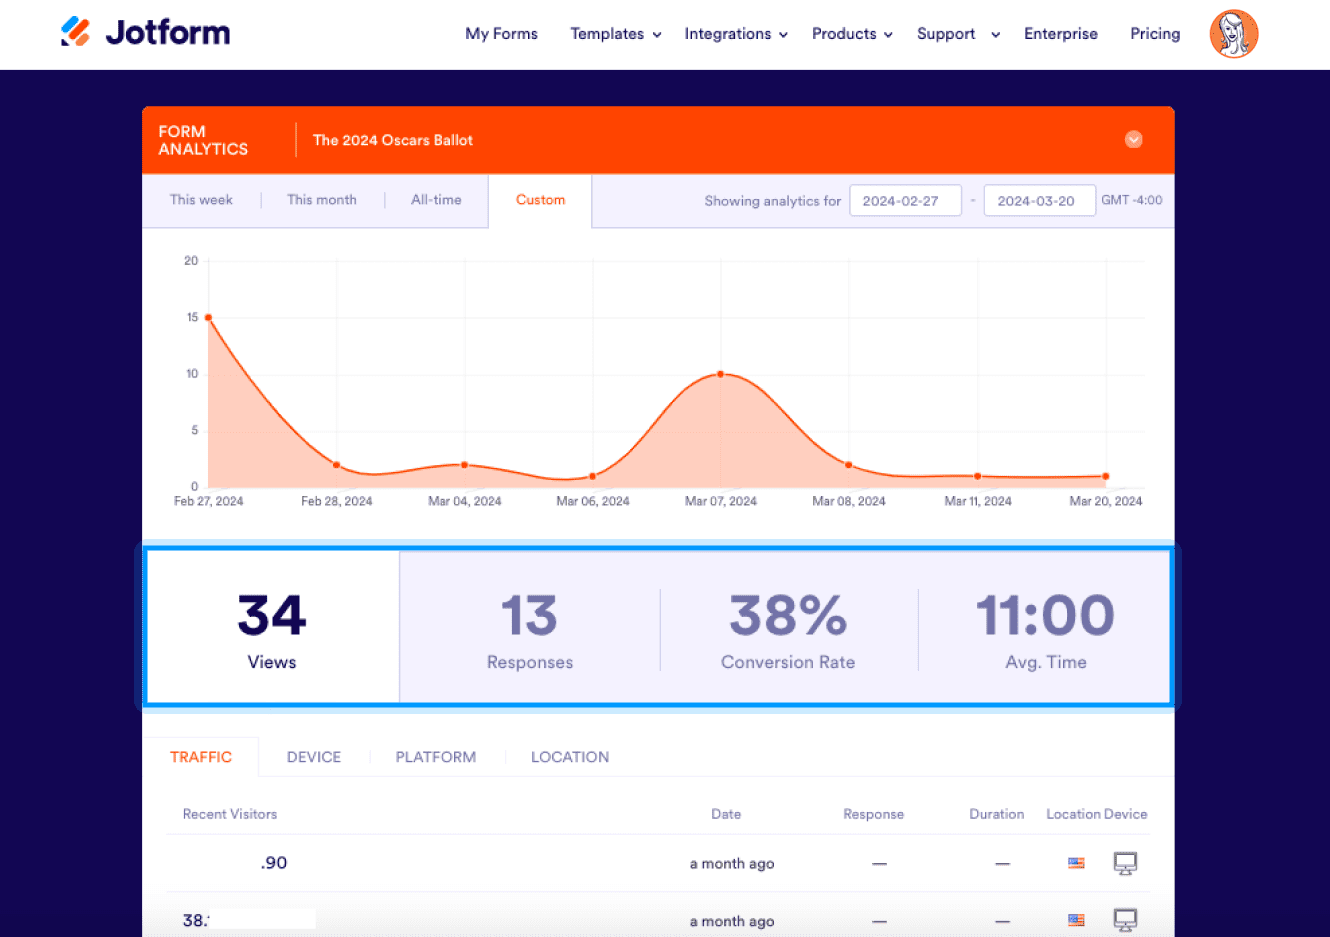
The conversion/response rate and average time to fill out a form are two key indicators of where your form may be succeeding (or failing).
For instance, typically the time to fill out a form and the conversion rate are directly correlated, but not always. That can depend on factors like the subject matter of the form, so a deeper dive into the analytics may be called for.
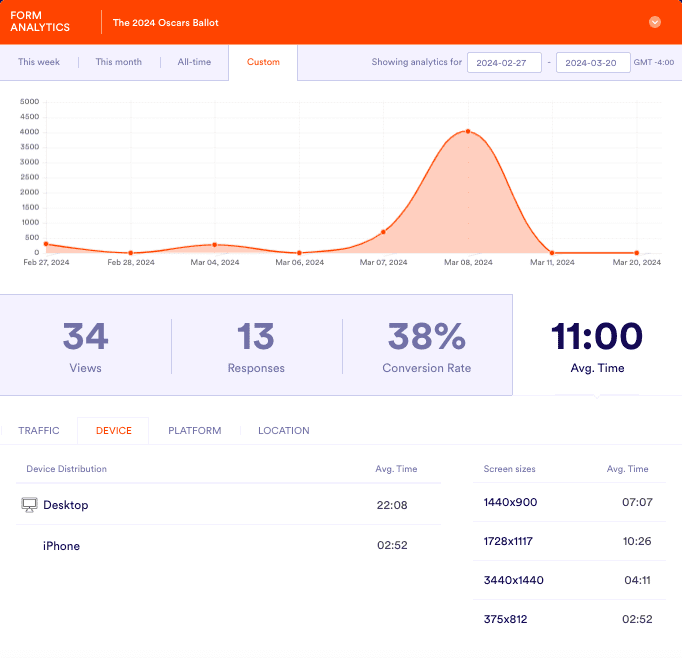
To gain more insight, let’s dig into Responses. By viewing the Traffic tab, you can see helpful information about the location your submissions are coming from and the kind of device your submitters are using.
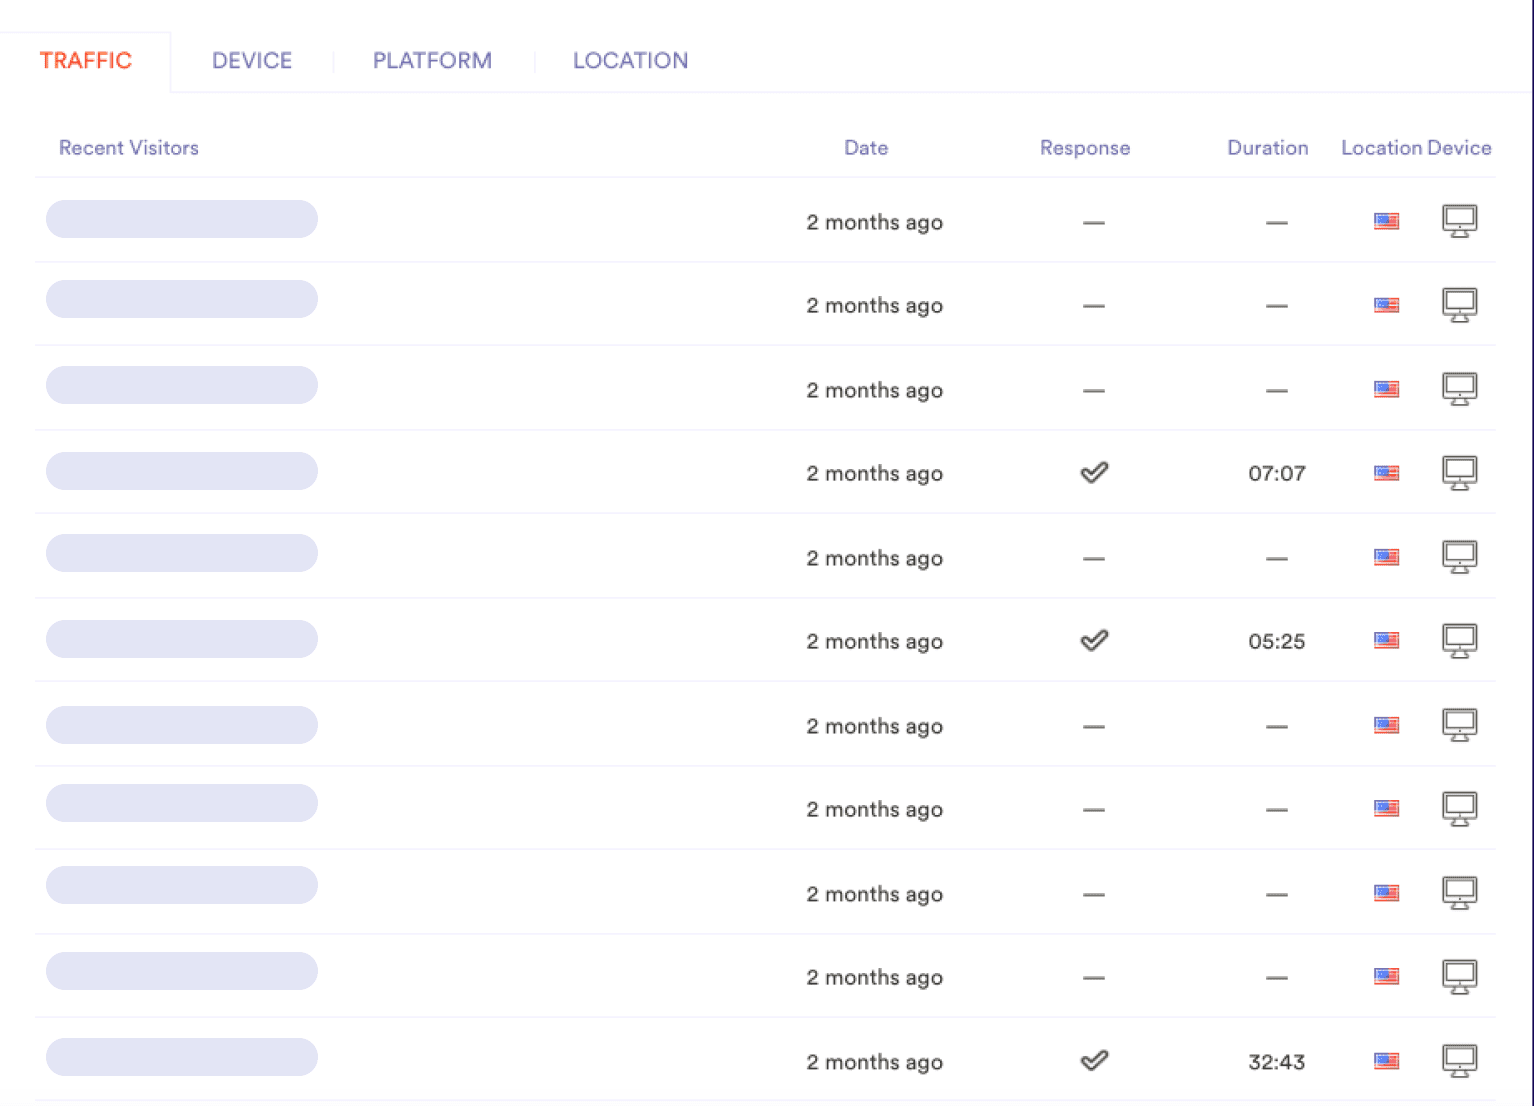
The device information can be beneficial. For example, if you have a longer form that needs to be viewed on a larger screen, and most responses are submitted on desktop, things are good. Conversely, if the majority of your submissions come in on mobile, you may need to switch to a form that’s shorter.
Pro Tip:
In the Traffic tab, you’ll see a checkmark if the visitor has submitted your form. If you hover over the checkmark and click View Response, you can view their submission.
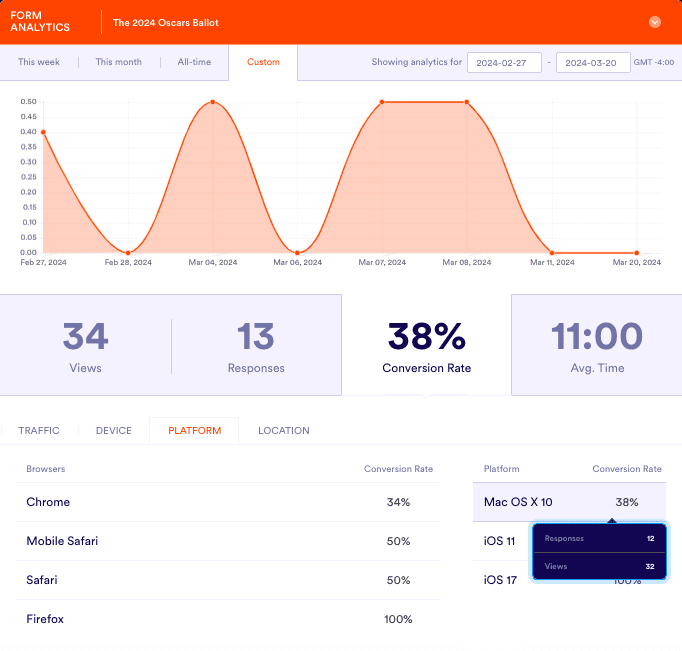
For more helpful information, let’s take a look at the Conversion Rate in the Platform tab.
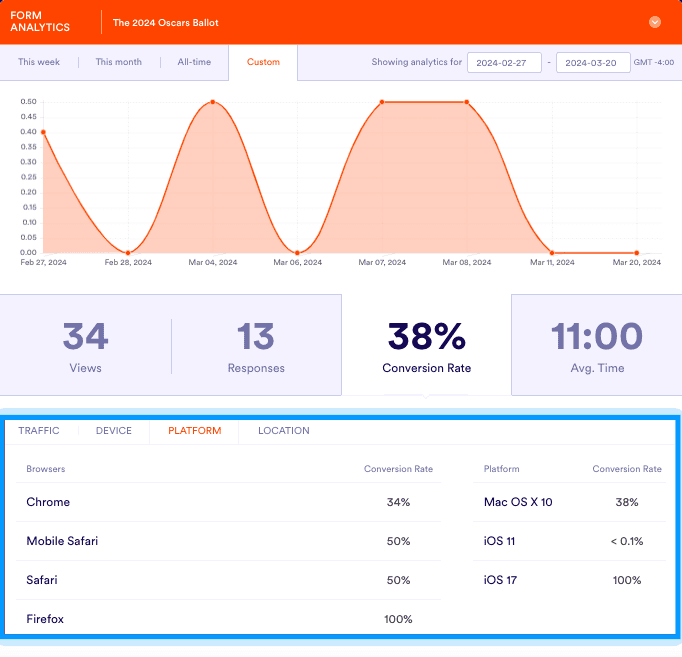
Here you can see the browsers and operating systems (OS) your submitters are using to complete your forms. This can be useful, especially if your forms are rendering differently based on browser or OS.
What if you notice a ton of views but very few responses for a given browser/platform? (You can see this info by hovering your cursor over the browser/platform in an entry.) You may want to alert your internal IT team to make sure your form is performing as it should.
The average time tab can also be instructive. One caveat for this, and frankly for all your submission analytics, is to make sure you have a statistically significant amount of data (or responses) to work with, so outliers won’t skew your results.
That said, viewing the average time by device and platform can provide some hints about your users’ tech preferences. In turn, this information can influence not only how you put your forms together but how you market them to your users as well.
The more you know, the better equipped you’ll be to meet your users’ needs and increase your form response rates.
With the information available in the Form Analytics dashboard, you’ll be able to build an efficient and effective workflow.
Work cited
Qualtrics. Getting started Mondays: Response rates (May 1, 2023). https://community.qualtrics.com/getting-started-mondays-79/response-rates-getting-started-mondays-may-1st-2023-22979