Since its founding in 1999, Salesforce has become the default platform for running many business operations. With thousands of integrations, connections, and plug-ins, Salesforce can do just about anything, and the benefits of Salesforce are nearly endless.
But even the best systems sometimes break. Anyone who’s tried to connect Salesforce to a form or point-of-sale system knows that sometimes even the simplest integrations act in unpredictable ways. This is where Salesforce debug logs come in.
Salesforce debug logs help users understand what’s happening under the hood, so to speak, to troubleshoot problems or figure out why results aren’t coming out the way they should.
In this article, we’ll take you from Salesforce basics to understanding Salesforce debug logs and how to use them.
What are Salesforce debug logs?
Like all software, Salesforce keeps track of everything that it does, and it stores this record in debug logs. These logs are a bit like your bank account statement: Every change that happens anywhere is recorded and stored in chronological order.
Unlike bank statements, though, Salesforce debug logs don’t just track one activity. Debug logs can include everything from changes to the database(s) to processes to calculations and even user interactions.
This level of detail can make logs difficult to read for those unfamiliar with complex logging systems, especially since critical information can appear in a variety of places or be duplicated across logs that track different things.
Pro Tip
Capture leads, create and update records, automate case handling, and deliver personalized support with Jotform Salesforce Agent, helping your team focus on higher-value work.
What are the different types of debug logs in Salesforce?
Not all debug logs in Salesforce are the same. Here are the different types:
- User debug logs: Salesforce user debug logs focus on activities that individuals perform. They track the way users interact with the entirety of the Salesforce system, including permissions issues, user interface (UI) problems, and object interactions.
Salesforce user debug logs are great for troubleshooting why some users may be running into issues while others aren’t.
- Apex debug logs: Apex is Salesforce’s programming language that allows developers to create custom logic. Apex debug logs store all the steps to execute this code. These can include every method, operation, query, exception, limit consumption, and interaction.
If you’re developing customized solutions, these logs are indispensable.
- System debug logs: The Salesforce system debug logs monitor the execution of built-in system processes. These are the tasks that Salesforce runs through as part of normal operations. They can also include scheduled processes, interactions with Apex code, or baked-in integrations.
System logs usually come into play when there are big problems, from the system as a whole not working the way it should to automations going haywire.
- Visualforce debug logs: Visualforce is Salesforce’s solution for custom interfaces. The Visualforce debug logs capture activity that happens when users interact with Visualforce pages.
Like a mix between Apex and user logs, Visualforce logs are important when you’re trying to understand why a custom solution isn’t working or is working in unpredictable ways.
- Platform events debug logs: The platform event logs capture the processes (or events) that run Salesforce’s event-driven architecture. Event-driven architecture is quickly becoming the standard for app development on Salesforce, and these logs ensure that events are moving through the system as the developer intended, with flags for publication, subscription, and handling, to name a few.
How to capture debug logs for troubleshooting
Salesforce debug logs are an important part of writing and troubleshooting custom logic for your business, but they aren’t all turned on by default unless you’re accessing the developer console. In order to get consistent and meaningful logs for specific users or actions, you have to turn them on manually. Here’s how to do it.
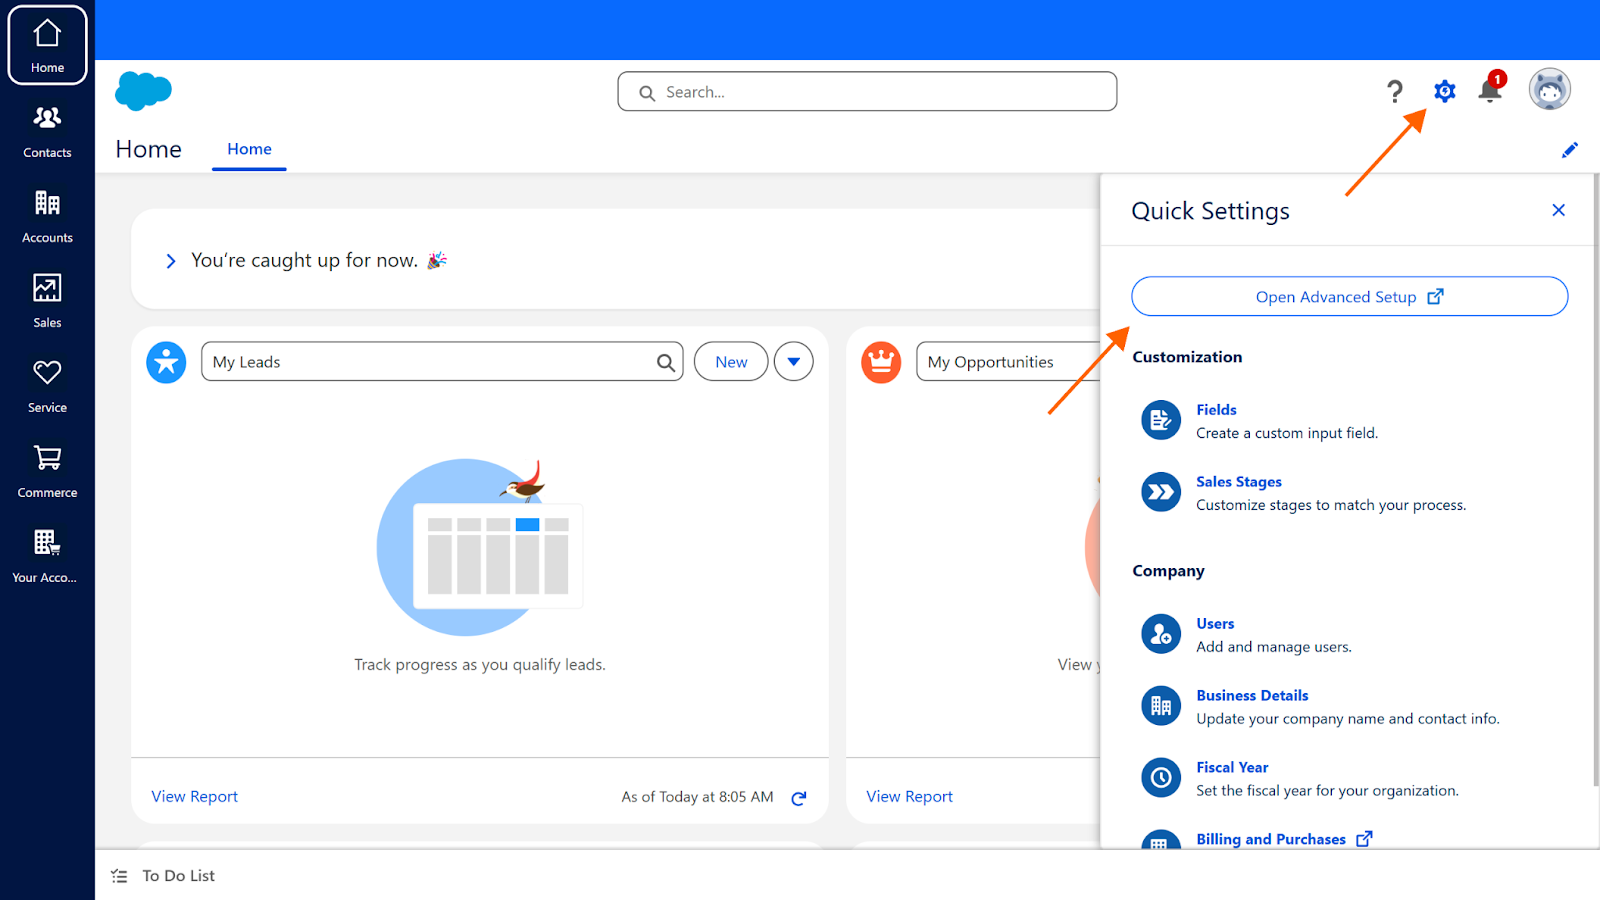
- The first step to capturing debug logs for troubleshooting is to navigate to the Salesforce Quick Settings menu and click on the Open Advanced Setup button.
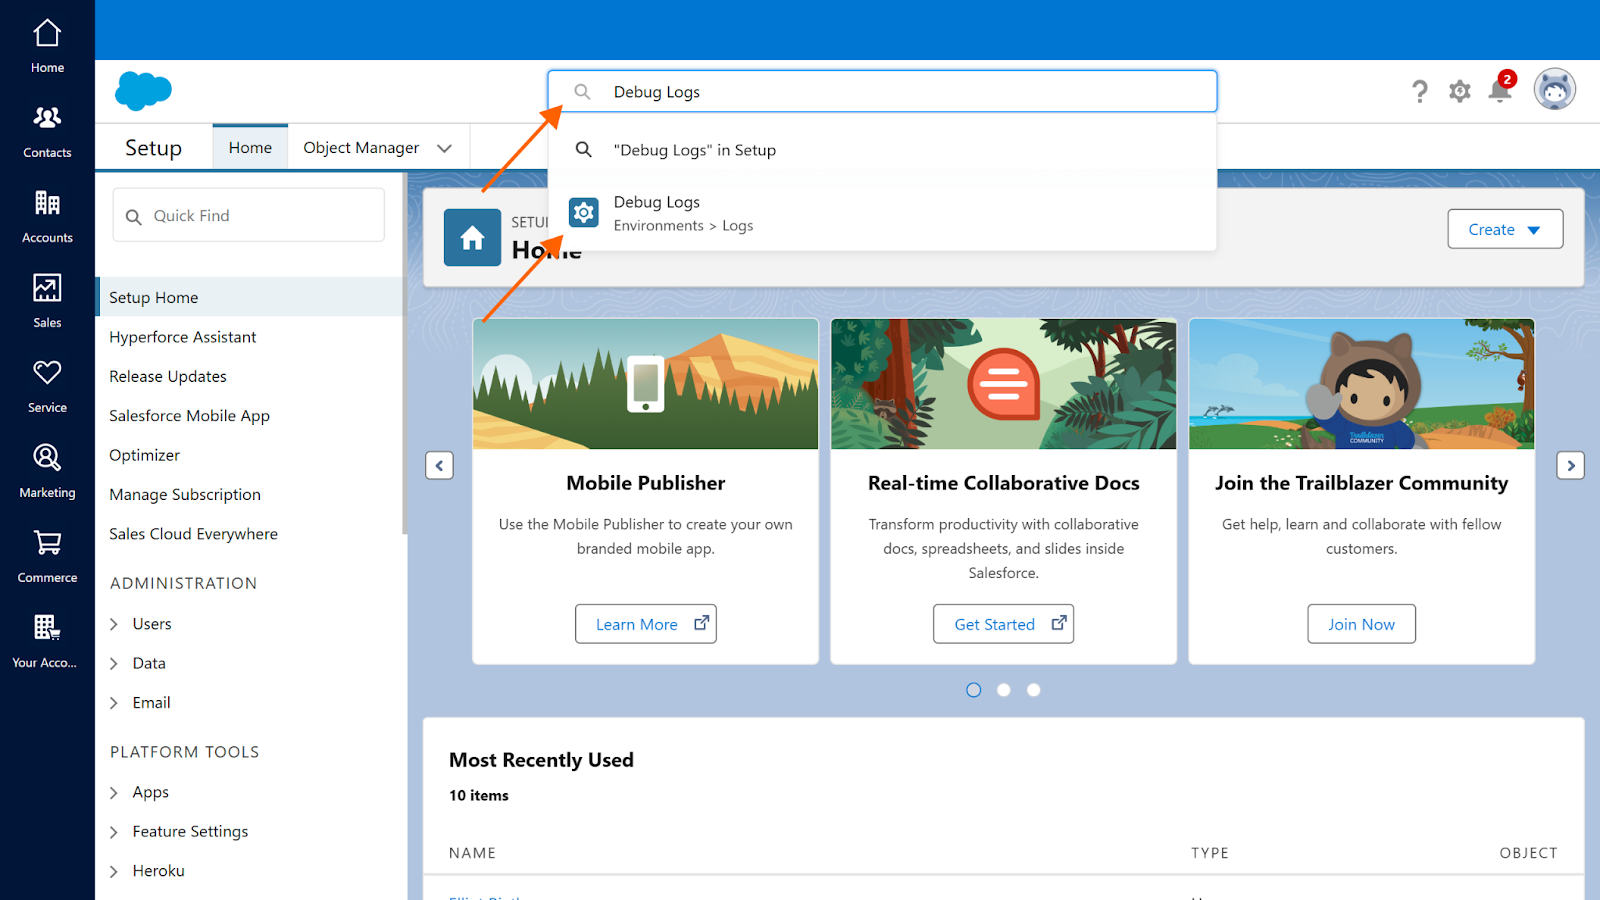
- Once you’ve entered the Advanced Setup menu, use the quick-find box to find the Debug Logs menu.
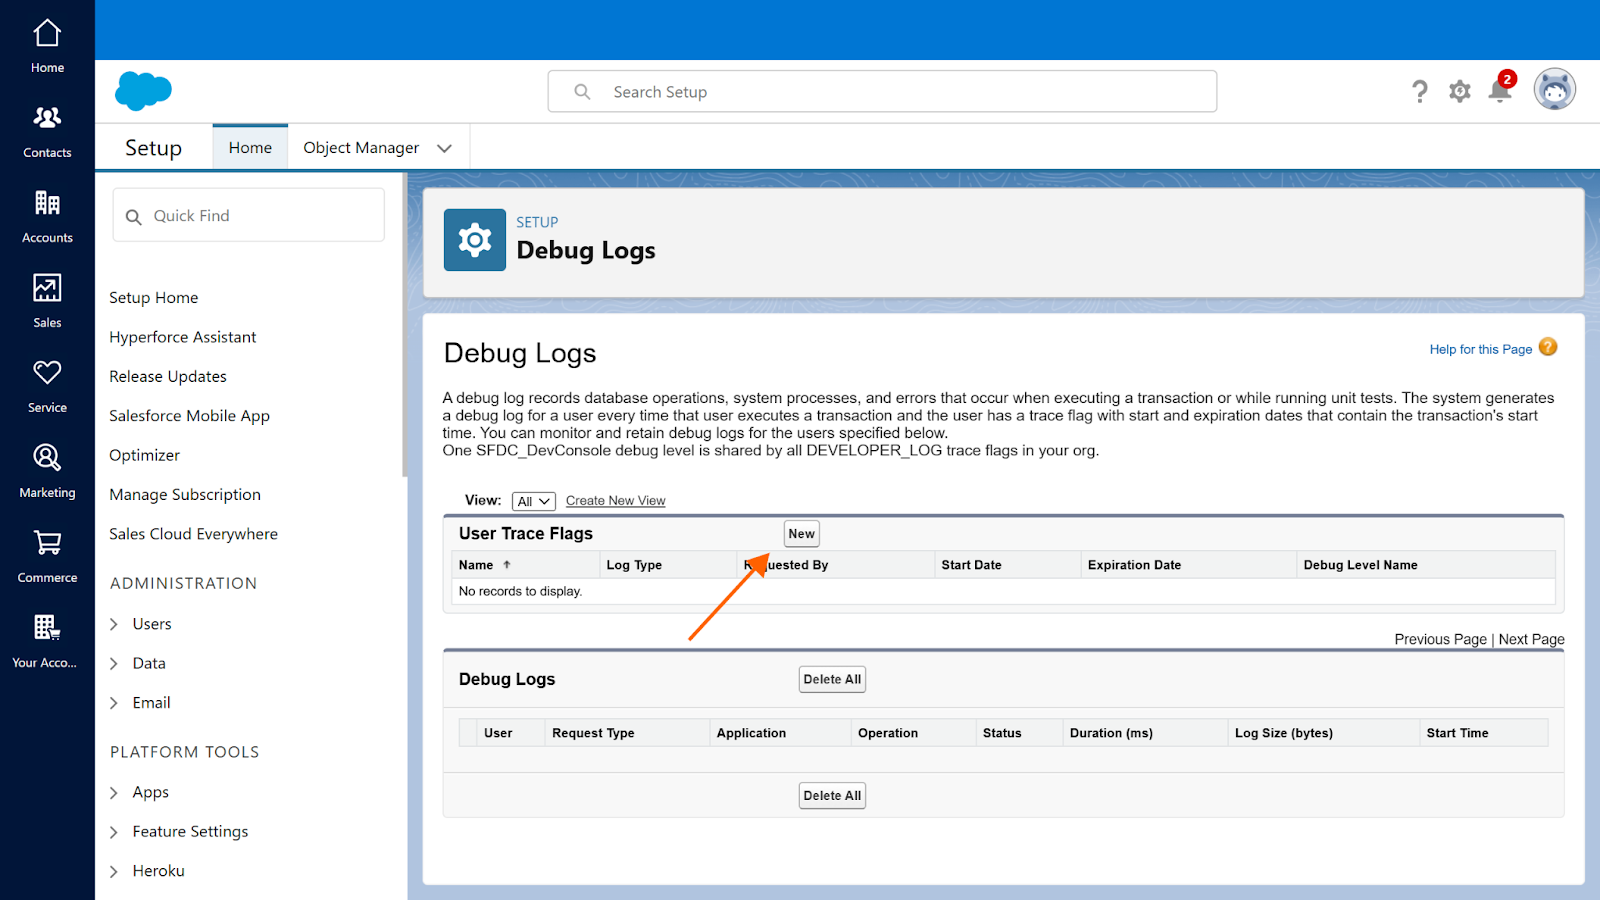
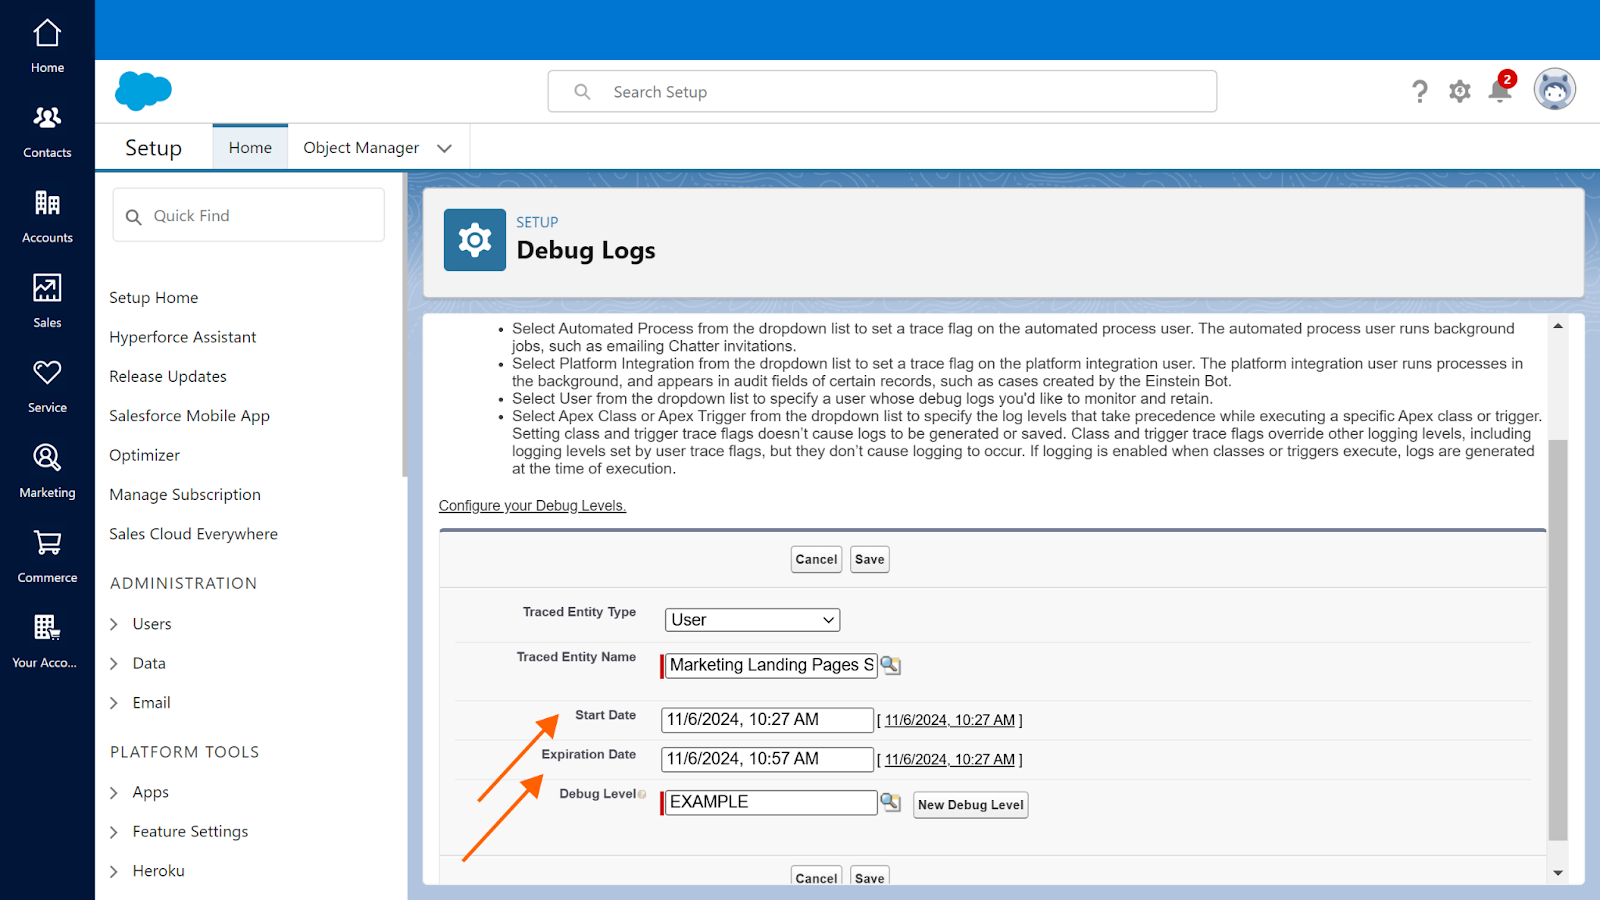
- Once you’re in the Debug Logs menu, you’ll need to create a new trace flag. The trace flag lets Salesforce know what you’re interested in logging and how you want the logs to display. In the Debug Logs menu, click New to open the trace flag dialogue.
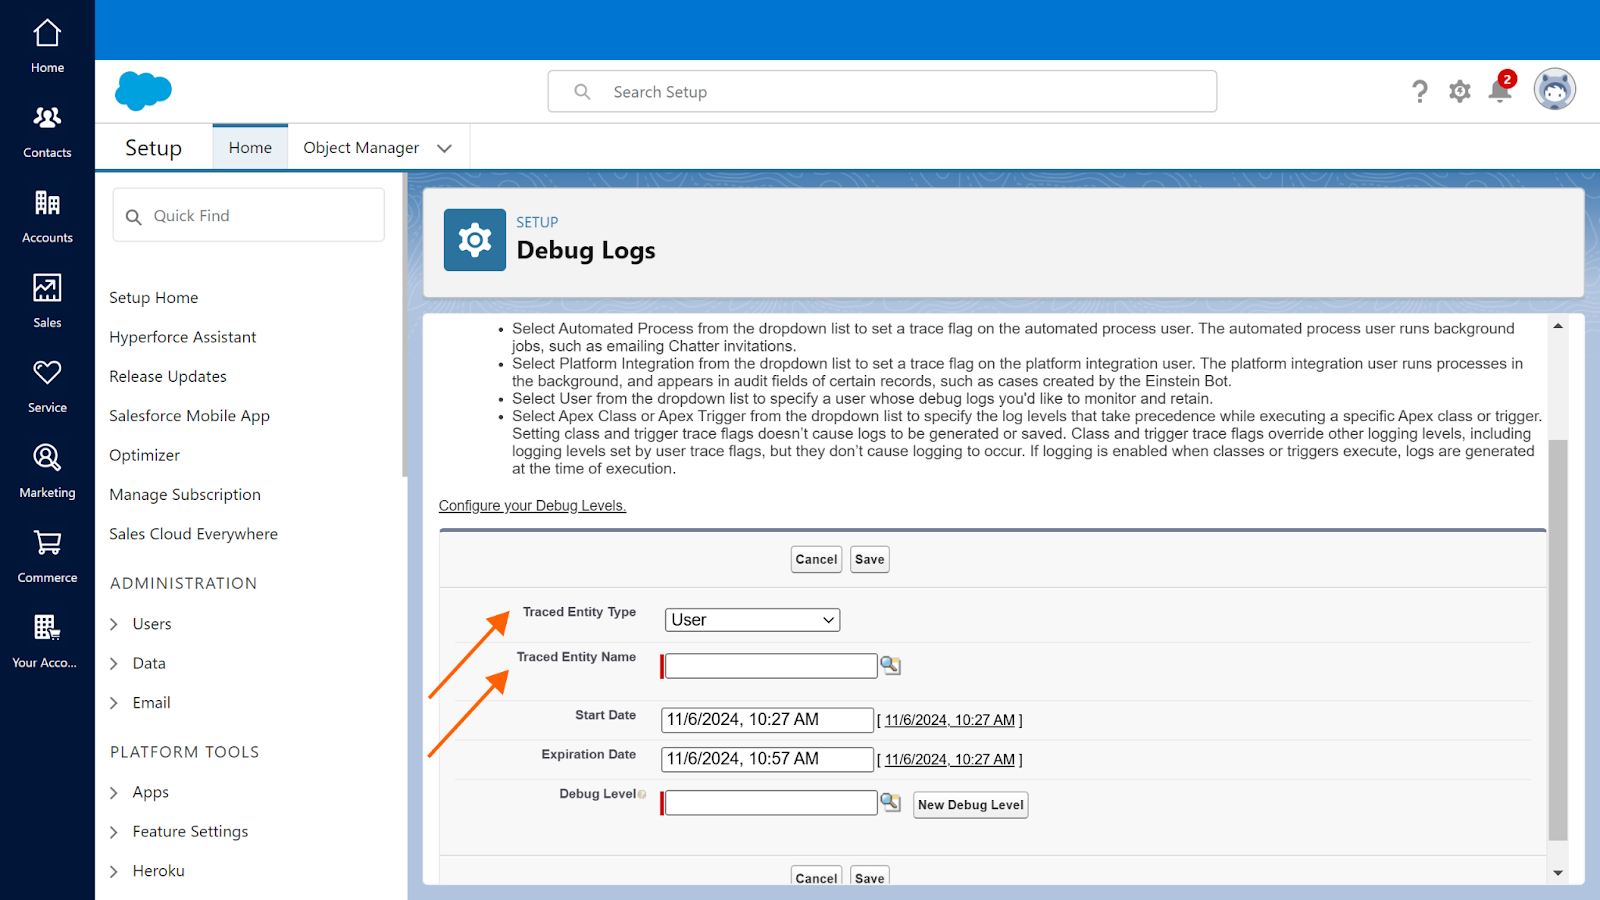
- Select the Traced Entity Type. These are similar to the Salesforce Debug Log type from above. Then select which specific entity you want to trace. This could be a user, an app, a class, or another type of data in Salesforce.
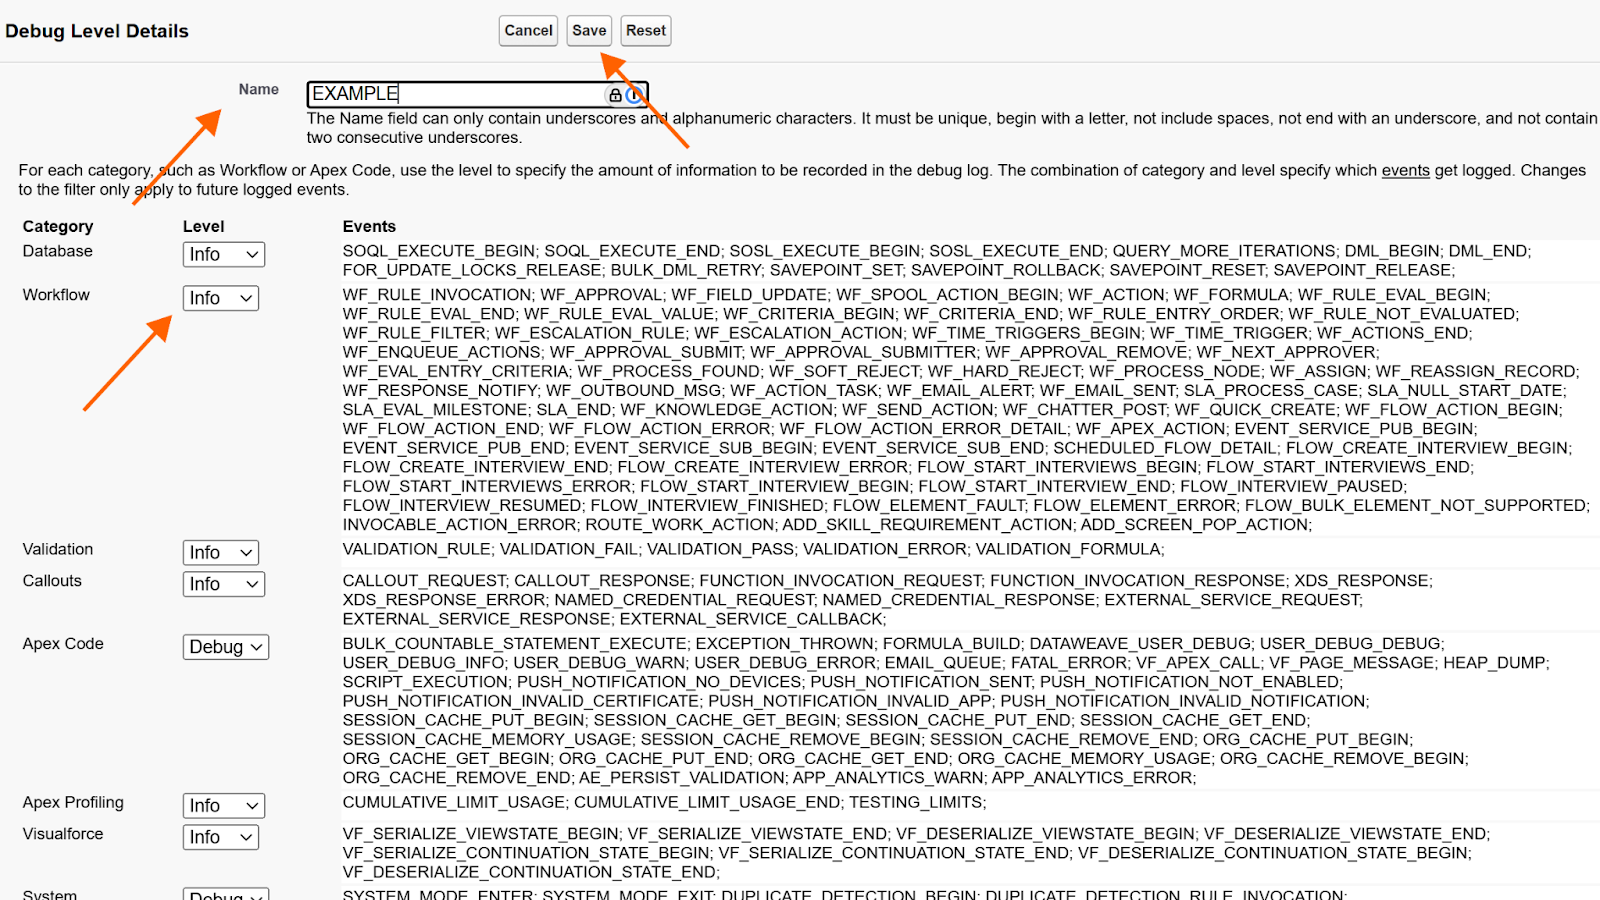
- You’ll need to set a Debug Level in order to tell Salesforce what to trace and how in-depth the traced information should be.
- Give the level a distinctive name and set the criteria to capture the precise data you want to observe. Once you’ve finished, click the Save button to create your new Debug Level.
- Finally, set the dates that you want to capture events for. This will create a trace flag and allow you to turn it on for specific users to capture errors.
Once your trace flag is created, capturing useful debug logs is just a matter of logging in to the user account the flag is set on and going through the steps that caused the initial problems.
How to view Salesforce debug logs
Viewing debug logs is easier than creating them. Just follow these steps.
- To view and analyze a log, navigate to Setup (as above), then enter Debug Logs into the quick find box and click on Debug Logs.
- From the list of available logs, select the one you want to view and click View. You can choose to either view the log within Salesforce or to download it as an XML file for viewing on your computer in an XML viewer of your choice. The structure of the log file will be identical for both.
- Logs will have information on the specific components you’ve chosen at a detail level that you selected when you set the flag. If the exact information you need isn’t showing up, you may need to go back to edit the debug level until you get the level of insight you need.
What are the Salesforce debug log categories?
There are different categories within Salesforce debug logs:
- Database: Salesforce database debug logs contain interactions with data: changes, queries, and anything that manipulates the database.
- Workflow: Salesforce workflow logs contain workflows you’ve established, from how the rules are set up and triggered to which processes are being executed when.
- Rule validation: Salesforce rule validation logs track when rules run and what the output is of each instance.
- Callout: API requests and responses from external services are categorized as Salesforce callout logs, providing a record of each call in XML format.
- Apex code: Apex code execution is stored in the Salesforce Apex Call log, including who made the call, when they made it, and what the input and output were at every step.
- Apex profiling: The Salesforce Apex Profiling category contains high-level information about Apex executions, including the quantity, runtime, and type of output.
- Visualforce: Any activity related to Visualforce pages is stored in the Salesforce Visualforce logs.
- System: The Salesforce System log stores the default system processes and the calls made to those processes.
For debugging activities, finding where things break requires looking through multiple categories and comparing outcome to the expected results.
Where Salesforce debug logs run into limitations
Debug logs are incredibly useful, but they also have some limitations. Storage for Salesforce debug logs is capped at 20 MB per log and 1,000 MB per organization. If you exceed the 20 MB limit in an individual log, the flag will continue logging new events, but older lines will get erased as they’re replaced by new ones.
If you exceed the organization-level limit, you’ll be blocked from creating new flags or editing old ones until you delete some logs. And if you exceed 1,000 MB in a 15-minute window, all trace flags will be disabled until you clear out the log files and figure out what’s causing the excessive logging.
Additionally, logs aren’t retained permanently. System logs are kept for 24 hours, while monitoring logs are kept for seven days. Maintaining an ongoing log requires remembering to download the debug logs daily and saving a backup copy or finding a tool to automate the process.
How to simplify Salesforce debug logging
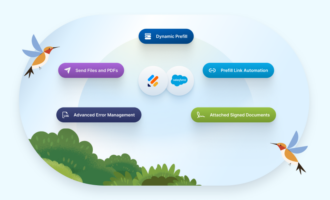
Keep in mind that many apps on the Salesforce AppExchange, like Jotform for Salesforce, come with their own logging features. The Jotform Salesforce integration, for example, has full integration logs and advanced error management features that make finding issues easy.
This feature helps users access detailed logs of all data transfers between Jotform and Salesforce, error notifications, and tools for diagnosing and fixing problems, so users can have the confidence that everything is running smoothly — or the insight they need to fix anything that isn’t.
Photo by Yan Krukau















Send Comment: