The Net Promoter Score, or NPS, is a management tool that quantifies the value of the customer relationships a business has built and provides managers with a summary of the customer experience. It’s a simpler alternative to traditional customer satisfaction research. The NPS measures the loyalty between a business and its consumers.
With assistance from colleagues at Bain & Company, and data supplied by NICE Satmetrix (formerly Satmetrix Systems), Fred Reichheld developed the NPS (and holds the registered trademark on the idea). Reichheld introduced the idea in his 2003 Harvard Business Review article, “The One Number You Need to Grow.”
Reichheld did for managers what Bill James and Sabermetrics did for baseball: Get everything down to one number by cutting through the biases that often come with lengthy customer satisfaction surveys.
The data
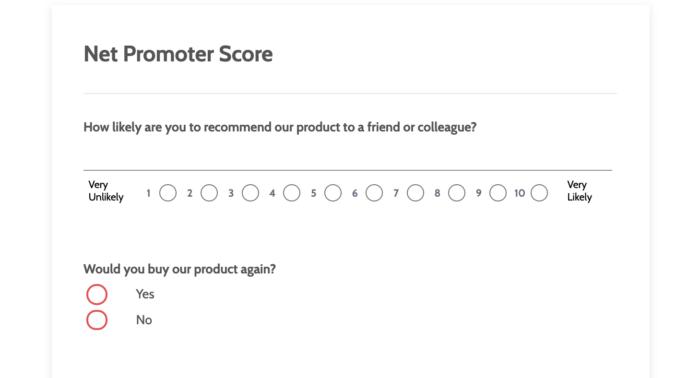
The beauty of the NPS is its simplicity. Its raw data is compiled from the answers to a single question: How likely is it that you would recommend our company/product/service to a friend or colleague?
The response to this survey question is a score from 0 (least likely) to 10 (most likely). The respondents are grouped into these three groups:
- Promoters: those who respond with a score of 9–10
- Passives: those who respond with a score of 7–8
- Detractors: those who respond with a score of 0–6
When implementing the NPS, companies are often encouraged to ask an open-ended follow-up question about why the respondent gave their score. While not useful for the NPS calculation itself, it does provide companies with valuable “why” data that can be helpful for improving their NPS scores in the future. Companies often find that improved NPS scores correlate with increased business growth.
The calculation
The Net Promoter Score is expressed as a number between -100 and +100. To calculate the NPS, subtract the percentage of unhappy customers (detractors) from the percentage of satisfied customers (promoters).
As an example, in a survey of 100 people, if 30 people give a rating of 9–10, 50 people answer with a response of 7–8, and 20 people respond between 0 and 6, the NPS would be
30% promoters
-20% detractors
+10 Net Promoter Score
If all respondents gave a rating of 9–10, then your NPS would be +100. Conversely, if all respondents gave a rating of 0–6, the NPS would be -100.
The process
The data collection and calculation of the Net Promoter Score is only half of the process. There are two more aspects of the process that help managers get the most out of an NPS system.
The follow-up
Remember the open-ended follow-up question we mentioned earlier? The responses to that question are provided to frontline employees and management teams for follow-up action.
The open-ended question is usually a transactional survey question that only appears in the survey if the customer responds below a certain threshold, such as a response to the initial question that scores below a 7 (detractor). The NPS, coupled with the answers to the “Why?” questions, provides managers with a way to identify customers willing to give references as well as opportunities for improvement.
Closing the loop
The Net Promoter Score helps managers identify customers they need to follow up with. The response data to the follow-up question provides important information to frame the conversation with the consumer.
Closing the loop, the final stage of effectively implementing a net promoter system, guides managers and employees in communicating with customers who have provided feedback. More important, it presents an opportunity to reduce the number of detractors while increasing the number of promoters. That’s how the Net Promoter Score can contribute to revenue growth.
Benefits and criticism of NPS
Ease of implementation
NPS is determined by the answer to one, direct question — would the customer recommend your company? This makes it easy to administer an NPS online poll. It doesn’t require expensive web design or statistical know-how.
An NPS poll can be conducted via email, social media, or posted on your website with easy-to-use NPS calculators like the Jotform NPS Score template. The single-question survey is conducive to higher response rates from customers.
Insights for management
The NPS does more than just provide customer feedback. Slightly tweaking the question can give managers insight into how different departments at a company are satisfying customers.
Changing the base question from “How likely is it that you would recommend our company/product/service to a friend or colleague?” to “How likely is it that you would recommend our service department/sales department/technical support to a friend or colleague?” allows you to compare scores and ensures customer interactions in all departments run smoothly. These departmental scores can be compiled and averaged to provide an NPS for the company as a whole.
Benchmarking
The Net Promoter Score is a standard measurement used by companies worldwide, so you can easily benchmark your score to see where you stand against competitors.
If your NPS is 58, but the NPS benchmark for your industry is 70, you have some issues to address relative to your competition. Conversely, if your score is 72, but your competitors all have scores in the low 60s, you’re doing something right relative to your NPS benchmark.
The caveat
If there is one criticism of the NPS, it has to do with industry barriers. There are specific characteristics in some industries that change the behaviors of the NPS customer category groups.
Let’s use the software development industry as an example. Some software packages are so large and complex that customers who score as passives (7–8) and even sometimes high detractors (5–6) may not go to a competitor simply because of the high cost of migration from one software package to another.
This doesn’t make your NPS score irrelevant, but it can make the answers to the follow-up questions even more important than the initial question in the survey. You should take into account factors like these when implementing a net promoter system.
Growth is the goal
Calculating the Net Promoter Score is the way to get a more objective read on customer loyalty. Regularly monitoring and improving your NPS is a key driver of customer retention and growth.
Net Promoter®, NPS®, NPS Prism®, and the NPS-related emoticons are registered trademarks of Bain & Company, Inc., NICE Systems, Inc., and Fred Reichheld. Net Promoter ScoreSM and Net Promoter SystemSM are service marks of Bain & Company, Inc., NICE Systems, Inc., and Fred Reichheld.


Send Comment:
2 Comments:
More than a year ago
How do you implement NPS in Jotform, I am unable to calculate the same in the reports
More than a year ago
thanks