5 of the top data analytics tools
Data analytics play a crucial role in the success of forward-thinking, proactive organizations. Leaders need to understand data to make the right decisions for their companies and get the insights they need to ensure future growth.
Data analytics tools provide that information.
These platforms enable companies to use their data to “identify new opportunities, predict the future, and prescribe the best path forward,” writes product management professional Terry Brown at IT Chronicles.
By providing businesses with information about data patterns, customer preferences, and market trends, data analytics tools help leaders make informed business decisions to better guide their organizations.
But which platform to choose? Below are five of the most effective data analytics tools for businesses of every size.
1. Tableau Public
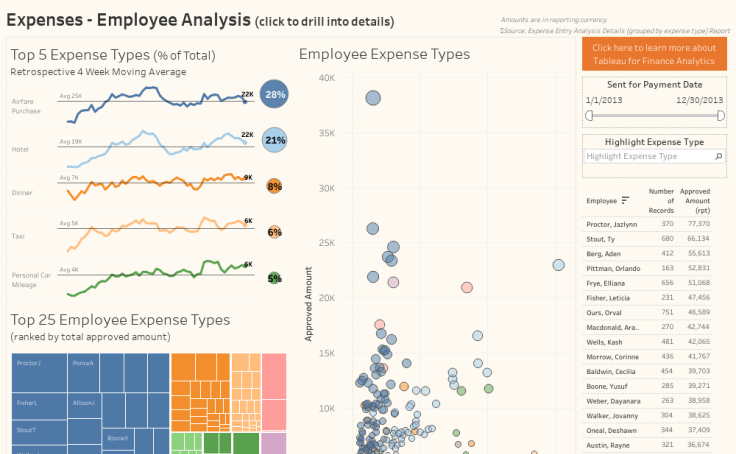
Tableau Public is a free data analytics tool that uses data to create interactive visualizations. Because the visualizations are published on the web, they update in real time. You can embed a data visualization — which Tableau calls a “viz” — in web pages and blogs, and share it on social media. In addition, users can download visualizations.
This user-friendly business intelligence tool is perfect for anyone interested in sharing visualizations of their data. Users don’t need to have any programming skills. The platform has drag-and-drop functionality that allows even the most inexperienced users to easily change data visualization elements.
Some of Tableau Public’s key features include an intuitive user interface, smart dashboards, support for multiple data file formats, and comprehensive analytics. What makes this tool stand out, however, is its data visualization capabilities.
2. R
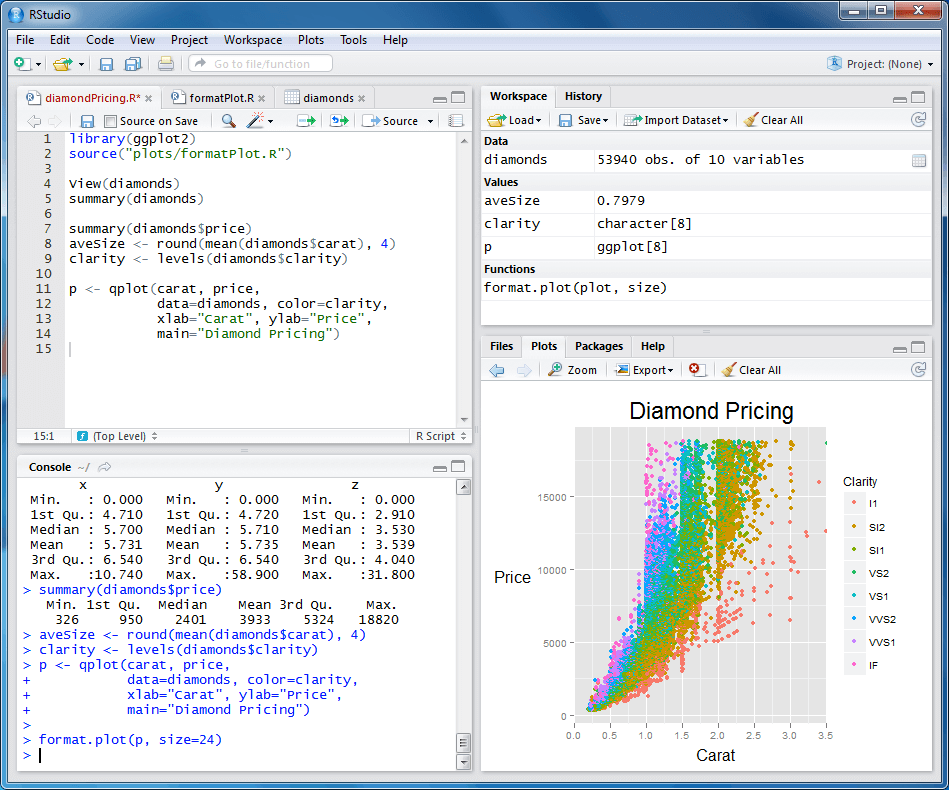
R is free statistical computing and graphics software that can easily manipulate data and present it in different ways. It offers a wide range of statistical tests, including linear and nonlinear modeling, classical statistical tests, and clustering. As a data analytics tool, R is especially suited for big data analytics.
R makes it easy to create publication-worthy plots, or visual representations of data sets. This data analytics tool also features
- An effective data handling and storage facility
- A full range of operators for array calculations
- A range of integrated tools for big-data analysis
- Graphical capabilities for displaying data, either on a screen or on paper
Though R was developed with statisticians in mind, people without any programming experience or knowledge can still use it.
“I wouldn’t even say R is for programmers,” says Matt Adams, senior data visualization engineer at technology skills platform Pluralsight. “It’s best suited for people that have data-oriented problems they’re trying to solve, regardless of their programming aptitude.”
3. SAS
SAS (Statistical Analysis System) is an easy-to-learn data analytics tool that can analyze data from any source. The platform offers a large array of statistical functions, a comprehensive and user-friendly Enterprise Guide to help users quickly learn its functions, and descriptive visualization through graphics.
It also offers Enterprise Miner, a tool for data mining and machine-learning projects.
SAS has been around since 1966 and specializes in profiling customers and prospects, predicting their behaviors, and optimizing communication. Key features include creative visualizations, interactive dashboards, easy-to-use touch-gesture controls, and integration with Microsoft Office tools.
This last feature is especially useful for collaborative environments where business executives proficient in Microsoft Office can access SAS and create reports.
4. Apache-Spark
With over 80 high-level programming operators, Apache Spark is an ideal data analytics tool that quickly processes large data sets and designs analytics reports for large volumes of data.
It boasts “components that make [it] the leader in working efficiently with big data at scale, which motivate a lot of big companies working with large amounts of unstructured data, to adopt Apache Spark into their stack,” writes Dilyan Kovachev, senior machine learning engineer at enterprise customer data platform Treasure Data.
The platform is capable of increasing data-processing speeds anywhere from 10 to 100 times. Apache Spark does this through its in-memory cluster computing capabilities, which keep the data in memory without writing to or reading from a disk. This capability also means that users can process data nearly in real time and join large data sets that require a lot of sorting.
Another stand-out feature of this data analytics tool is its ability to integrate with a variety of devices, external apps, software solutions, and operating systems. It also provides built-in APIs in Java, Scala, or Python.
5. RapidMiner
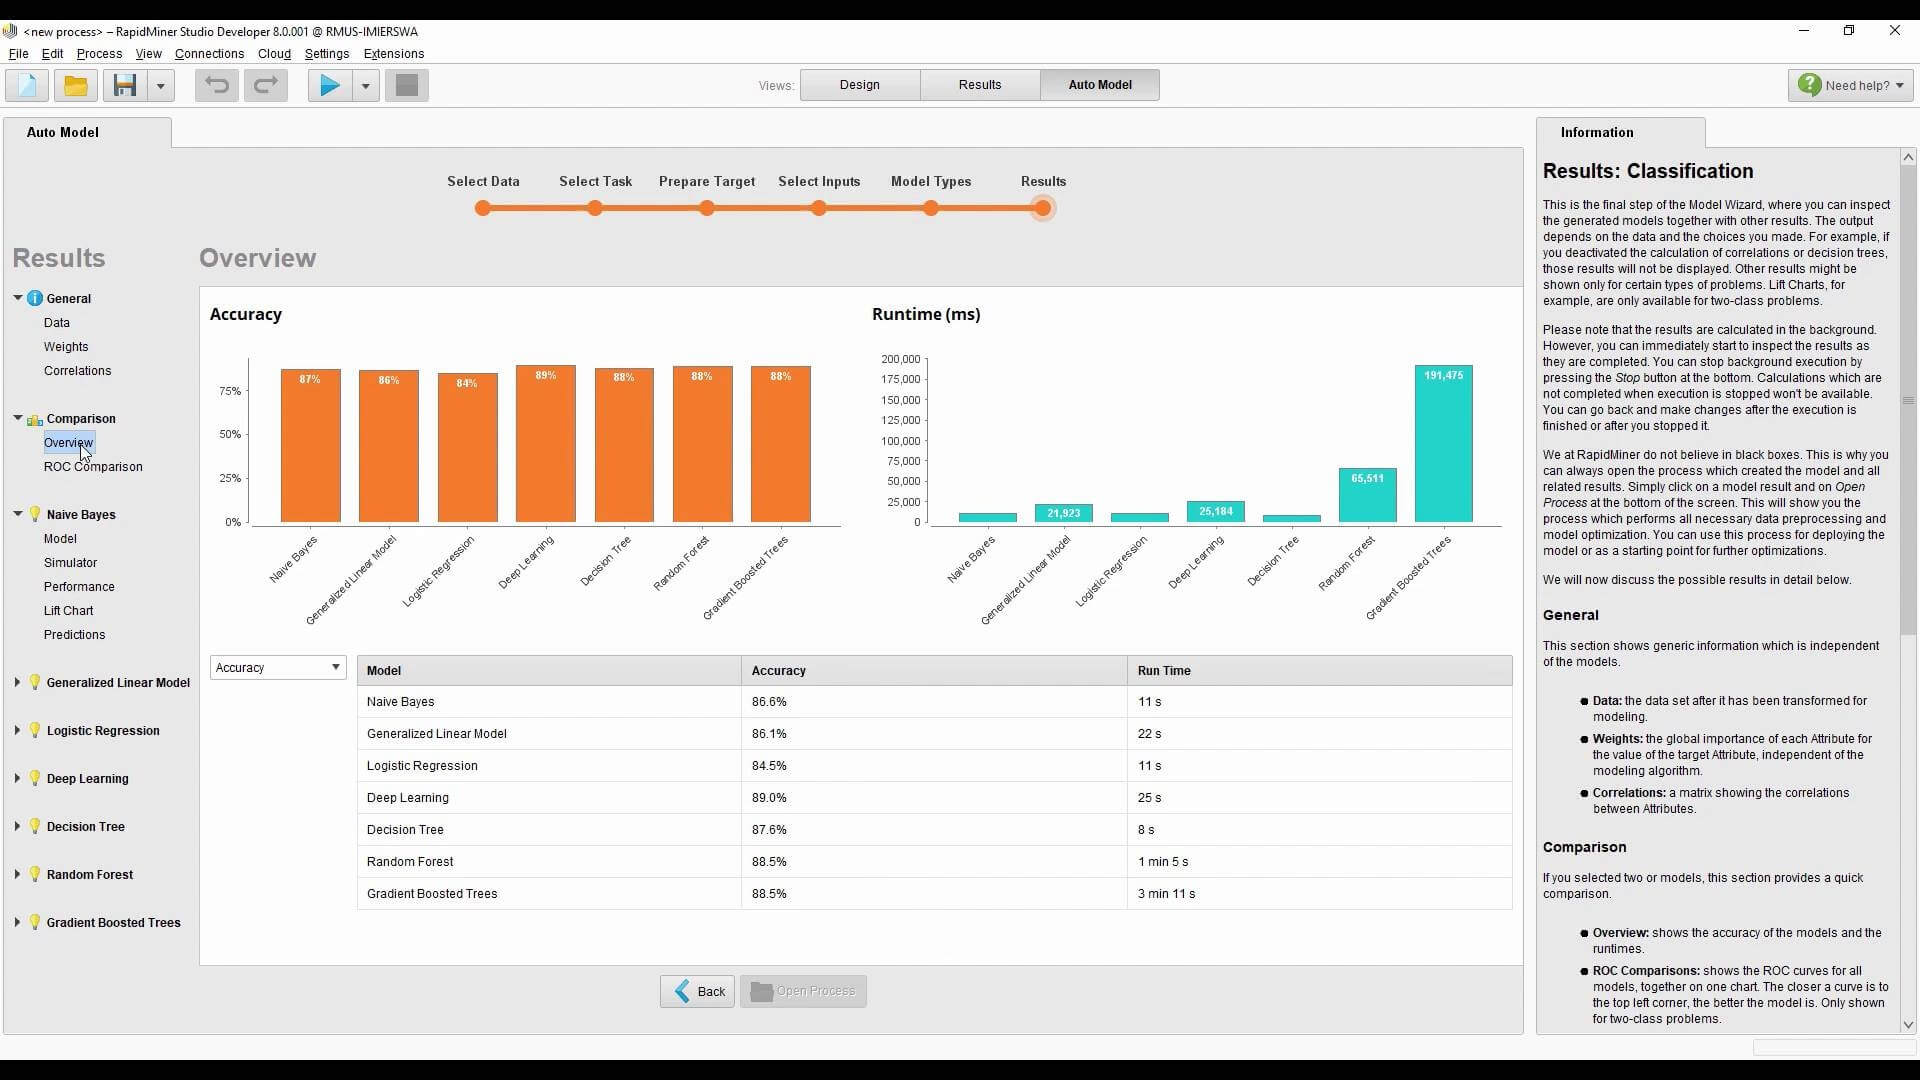
RapidMiner is a user-friendly data analytics tool that integrates machine learning, data mining, and predictive analytics into one environment. The tool automates analytical processes and simplifies operational procedures, which means users don’t need any coding experience to get useful results.
Strengths of RapidMinder include
- Options for setting up a cloud-based database that stores high-volume data, in addition to its own collection of sample datasets
- A drag-and-drop feature to help nonprogrammers implement procedures easily and efficiently
- Trainable deep-learning algorithms
- Real-time data collection and modeling
No matter how big or small the organization, this tool is scalable and perfect for any size team.
Companies in all industries, of every size, need data to thrive. As the team at educational technology company 2U writes, “Data analytics can help companies describe their businesses, look at reasons why positive or negative things have happened, generate information they may not have, and advise on possible action plans to take.”
Each of the data analytics tools above can help organizations let data drive their business decisions.









Send Comment: