-
ArcsightAsked on May 1, 2015 at 5:23 PM
Hi,
Is it possible to show a graph of how many users have voted and their votes in a chart after every user submits its votes?
Thank you
Daniel
-
jonathanReplied on May 1, 2015 at 6:36 PM
Hi Daniel,
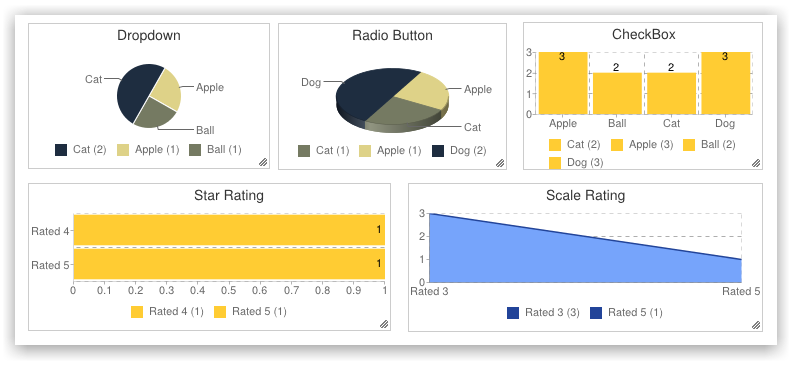
You must be looking for the JotForm Visual Report.
Please check the user guide on -How-to-Create-a-Visual-Report-with-your-Form-Submissions

Let us know if you need further assistance.
Thanks.