-
agirassocAsked on April 24, 2014 at 9:17 AM
hello
I create a form with questions.
I wish to have a full report, with statistics for all of the answers.
How to make?
-
Ashwin JotForm SupportReplied on April 24, 2014 at 10:57 AM
Hello agirassoc,
There are a lot of options available to generate your form's submission report. Please take a look at the following URL : http://www.jotform.com/help/chapter-6-Reports
I am not sure how you want to display the statistics data but you may like to take a look at our "Visual Report Builder" which will help you generate report with graphical representation of data. The following guide should help you: http://www.jotform.com/help/187-How-to-create-a-Visual-Report-with-your-Form-Submissions
Hope this helps.
Do get back to us if you have any questions.
Thank you!
-
agirassocReplied on April 24, 2014 at 11:18 AM
Thanks
I took the report generator. It gives me statistics of the two first question. Not the other 30 I want the statistics for each responses in "%"
Based on statistics, in %, I could do the math
and create an array with the answers.
-
Welvin Support Team LeadReplied on April 24, 2014 at 12:34 PM
Hi,
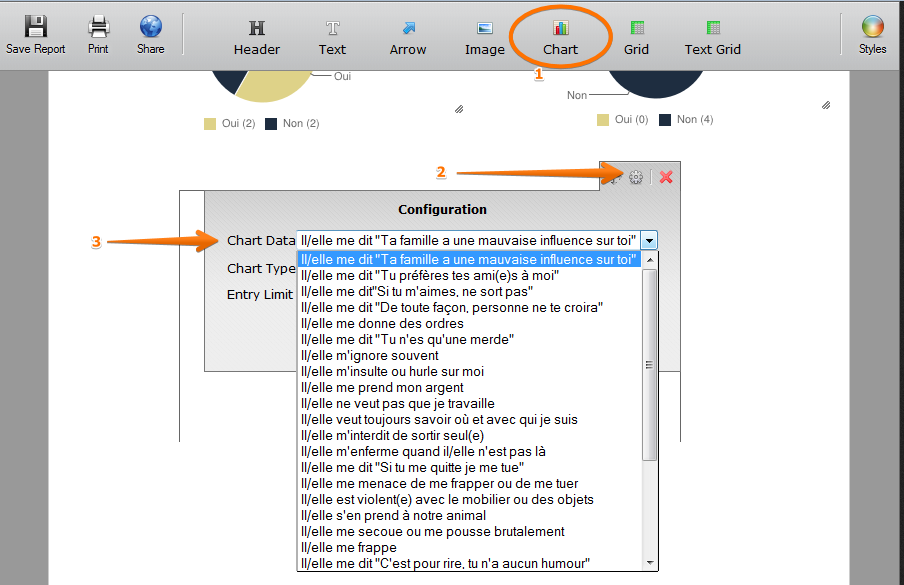
You can edit and add another chart to the Visual Report. Just drag the "Chart" button to the editor > click Settings > choose "Chart Data (this is your form fields)"

Make sure to click OK button then SAVE REPORT button from the top toolbar. Unfortunately, the chart will render a fix number, not by percent.
Thanks
-
Welvin Support Team LeadReplied on April 24, 2014 at 12:37 PM
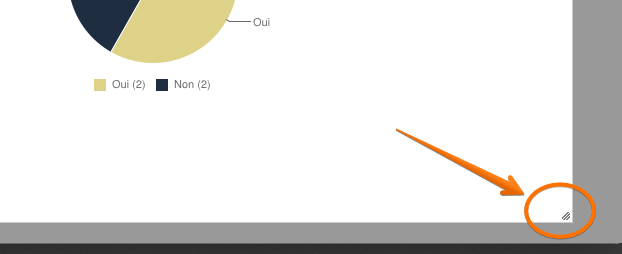
By the way, you can adjust the height of the report by clicking the "Resize" button, hold then drag to the bottom:
Thanks
-
agirassocReplied on April 24, 2014 at 1:01 PM
Oki
Thanks, nous allons tester celà.
-
CarinaReplied on April 24, 2014 at 2:18 PM
If further support is needed please let us know.
Thank you
- Templates
- Integrations
- Products
- PRODUCTS
- Form Builder
- Jotform Enterprise
- Jotform Apps
- Store Builder
- Jotform Tables
- Jotform Inbox
- Jotform Mobile App
- Jotform Approvals
- Report Builder
- Smart PDF Forms
- PDF Editor
- Jotform Sign
- Jotform for Salesforce Discover Now
- Support
- GET HELP
- Contact Support
- Help Center
- FAQ
- Dedicated Support
Get a dedicated support team with Jotform Enterprise.
Contact Sales - Professional ServicesExplore